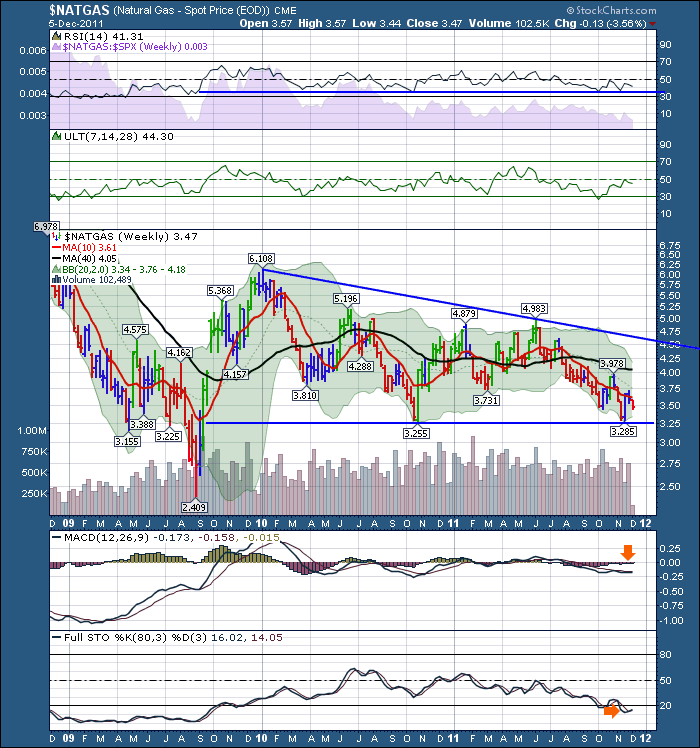
Here is the Weekly for $NATGAS.
Definitely at a place on a chart to look for an upside reversal. Bouncing off the 2 year low trendline.
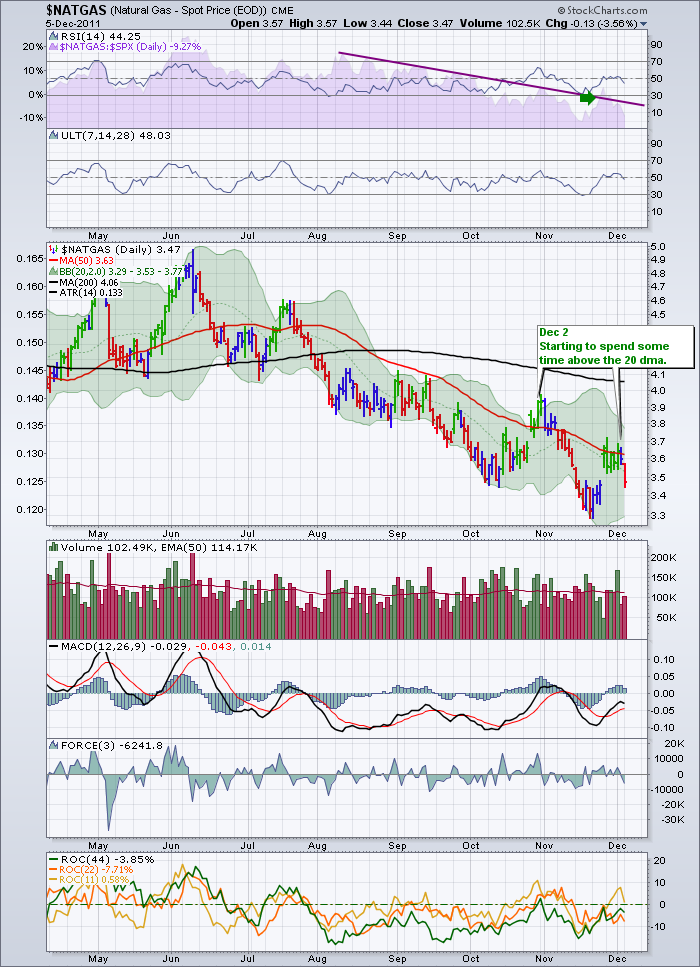
Here is the Daily.
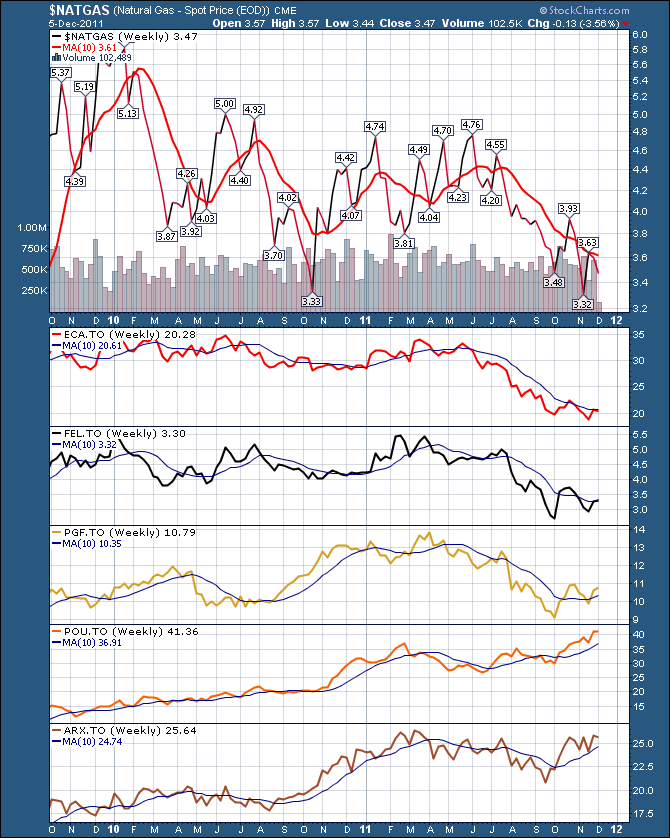
Here is our dashboard for the $NATGAS sector.
Encana is still struggling below the 10 week. Interesting how every chart is different here. Some at new highs, some trying to break through a 52 week ceiling, some trying to get off 2 year lows...really a wild group.
Remember to register for Ed Carlson at the CSTA in Calgary on December 13th. We have already registered enough to fill 1/2 the room, so please make sure you reserve a spot. It will definitely be a sold out show!
I just wanted to mention a skype call last night with an investor who is interested in technical analysis. Even after using the website for over 3 years, I still admire stockcharts.com flexibility.
Being able to place bonds, stocks, commodities, and currencies on a single graph and compare them is just such an advantage to helping understand the intermarket relationships going on. This simple function is critical to good Technical analysis. Or being able to graph indicators that are not stocks and still apply ratios or oscillators to the chart is really flexible.
Being able to share how to sort charts, create chartlists, set up a group of charts to review, making scans, and saving your work everyday in a consistent format is a real pleasure. The value in charting is the ability to leave notes on the chart each day. Somedays you are more alert, and notice simple structures starting to form. Being able to record your thoughts on the chart, helps the analysis in future reviews.
I noticed this weekend my years of being a stockcharts.com badge increased by another year. I hope that the European customers keep enroling so we continue to get the benefit of watching European charts from a distance. Just a note to say thanks to all the programmers who make the site work.
Good Trading,
Greg Schnell, CMT


