Here were some of my comments in the blog two days ago.
6) We have hit the fib levels on the index and on crude. Gold made moves above the fib levels, but the gold stocks have not.
7) Gold and oil opened higher today but the TSX opened weak. That is a simple piece of news that has been going on for a few weeks now.
++++++++++++++++++++++++++++++++++++++++++++++++++++++++++++++++++++++
Below are my introductory remarks about crude at $100. My biggest concern was that oil stocks were not following oil higher.
++++++++++++++++++++++++++++++++++++++++++++++++++++++++++++++++++++++
11/13/2011
There's something strange going on around here.. Crude Oil
Well, that was a very interesting week in the oil and oil stocks market.
First of all, let's review crude oil and where it is priced.
In the blog a few weeks ago, we suggested a good upside target for oil would be arond $99. How did we come up with that? At the time oil was in the $93-$94 level.
1) The 61.8% fib level is shown in gray on the chart. It was $99
2) The top of the BB has moved up slightly this week to $101. A few weeks ago, it was close to the same level as the BB. Remember, you can read the actual values in the top left of the chart.
So here we sit with a substantial move higher in crude. From October 4th to November 14 Crude has moved over 30% in under 6 weeks. Who would have called that? Great Question...
Let's stare at the chart.
A few things I notice.
1) We have previous weekly highs here at $103 and $100. We have the BB at $101 and we have the fib level at $99.
2) The enthusiasm for crude to run up from here will be muted in that a crude price above $100 really cuts into consumer spending as they allocate more towards gasoline and home heating oil.
3) In order for $WTIC crude to go lower, it first has to have some of it's momentum slow. For the last 6 weeks, we have closed near the highs of each week.
++++++++++++++++++++++++++++++++++++++++++++++++++++++++++++++++++++++++++++++++++++++
Now, blogs always prove that we are seldom right. The reality is in the market, we don't know when the psychology of the masses will finally change from bullish to bearish or visa versa. But we keeping reading the charts, looking for volume and price clues to explain what is going on. EACH and EVERY DAY!
Being right today, doesn't mean it will hold. The charting data plots the psychology of the masses towards owning a certain stock. The charts only increase the probability we are right. I have found (usually when the brick hits me over the head), I can be wrong!
Events change every day which changes the popular view. So, lets focus on the oil stocks dashboards today.
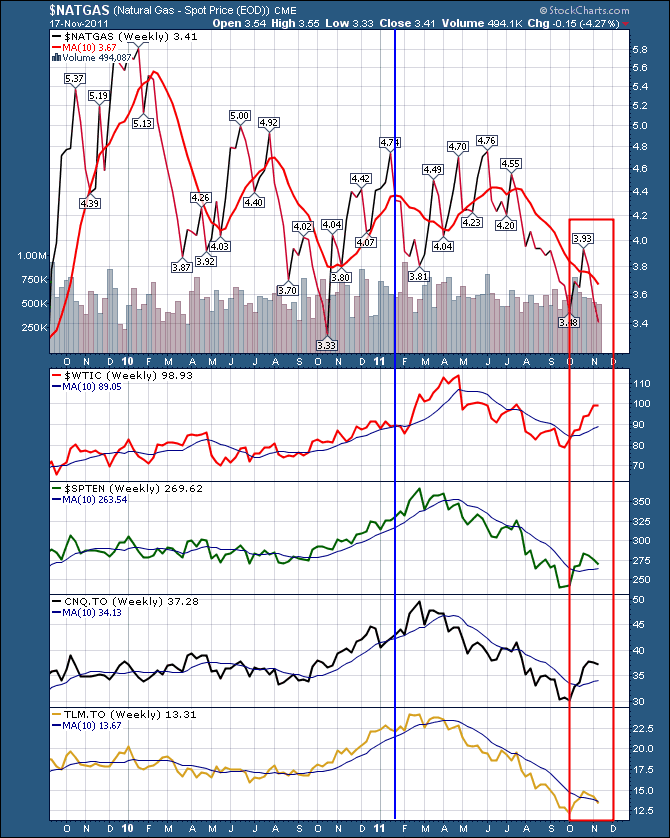
Here is a simple dashboard with just a few charts to identify what we are doing with these dashboards.
THe dashboards allow us to not only see how the individual chart looks, it allows us to quickly compare it to the other charts that affect the stock or other similar charts.
So here we have $NATGAS...Wow, this thing is so unloved, it could be a European leader public opinion poll chart.
Then we have $WTIC. this thing is so loved currently, it looks like a Leafs fan planning the Lord Stanley parade since the season started. OK, it is still pointed higher.
Then we have $SPTEN, This is on a major downtilt....what's going on? I wonder what is affecting it?
Then we have CNQ.TO which is CNRL. Historically a great stock market darling, but not since March.It has received some recent investing but it is clearly rolling over. What I do know is that CNQ has a lot of Oil and Gas.
Then we have Talisman. Is this just the spouse of the unloved European leader? I do not know the % of Oil or Gas for Talisman.
Now, let's compare them to each other.
$NATGAS has been in a down trend along with everything else since May.
$WTIC has been in a downtrend since April 30. The recent push up to $100 continues like a golf ball off a nine iron! $weet!
$SPTEN has been rolling over for about 4 weeks already. That's odd relative to oil.
CNQ has had a nice push, but it has clearly stopped following oil higher. Behaving like $SPTEN but slower to turn down It seems to be only about 2 weeks. (just eyeballing it)
TLM has barely got above the 10 MA. Either it is a company loaded with Natural gas, or it is really underperforming, but it has barely been able to climb above the 10 week MA. I won't be buying that one. It was one of the last to climb above the 10 MA, and it rolled over as soon as the $SPTEN did. very average at best. It is already below it's 10 week. Wow, compared to CNQ, it is weak. I would rather buy CNQ on a pullback as it seems stronger than average.
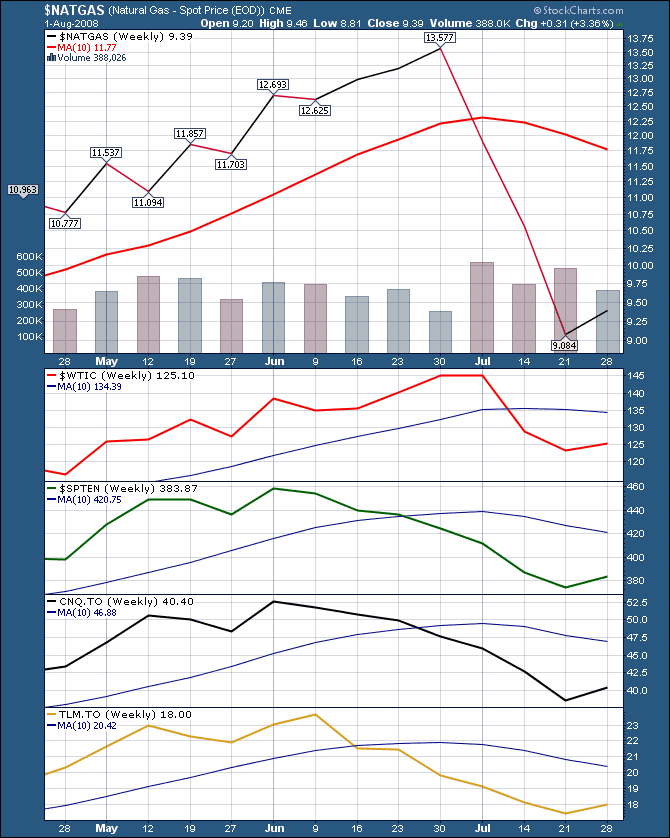
More importantly, CNQ a relatively good stock, and TLM a stock 'out of favour', as well as the $SPTEN are all heading south but Crude is still going north...this should start sending alarm bells. Go back and review 2008 oil peak.
Notice at the blue vertical line, oil stocks continued higher as oil paused. This time, the stocks have rolled over before the oil....hummm.
Here is the 2008 Version of the Oil Top. Notice how the sector and the stocks had let go before the commodity did.
OK. That was an indepth view of why and how we can use the dashboard for a little bit of cross market analysis. John Murphy is the absolute doctor on intermarket analysis. Some of the best clues come by looking at things that normally correlate and keep track when that changes. Think the $BRENT and $WTIC spread. Collapsing by 70% in a few weeks....HUMMM something strange going on ..It just makes us put our rabbit ears up.
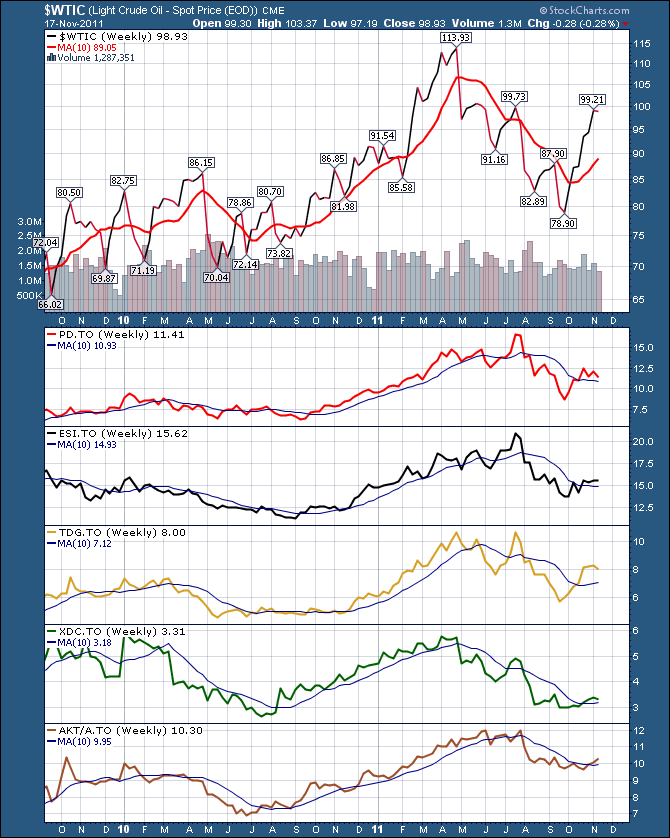
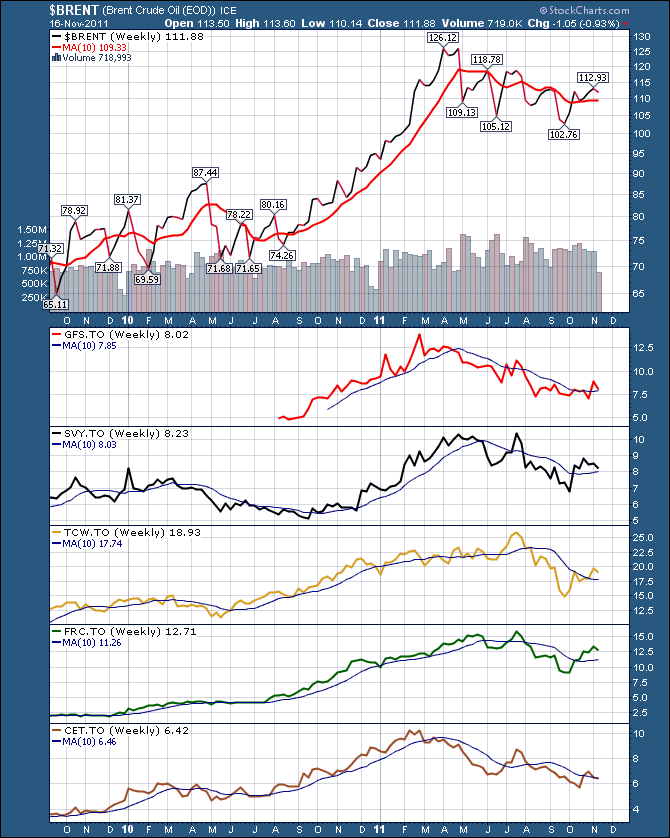
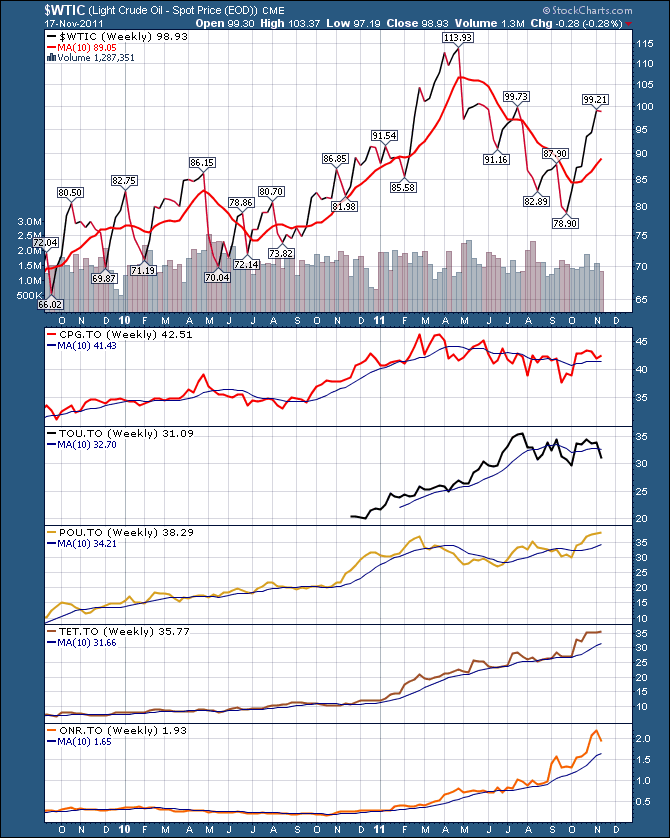
Below are just some example dashboards. you can do the same exercise as above.
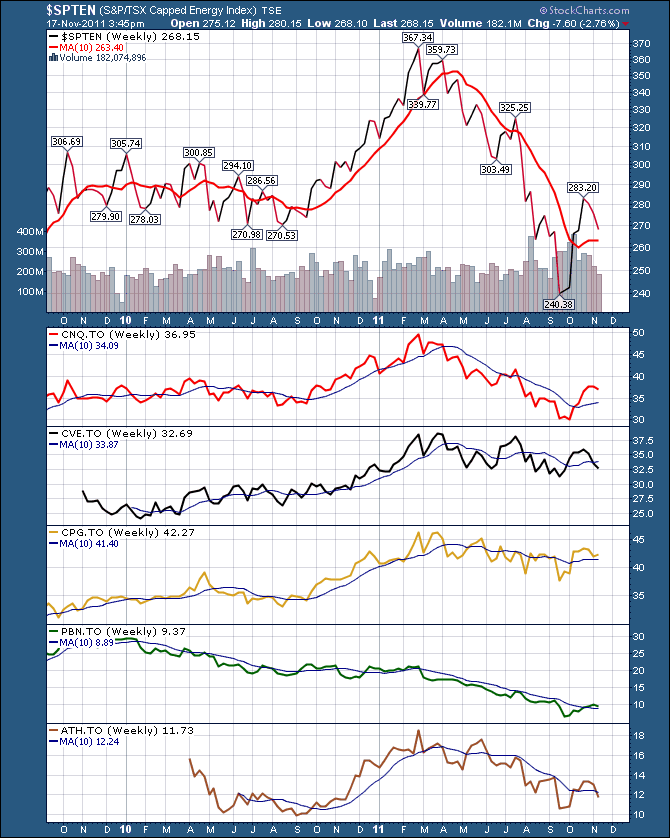
Here are some oil producers. CPG and PBN are in the Bakken and the others are oilsands.
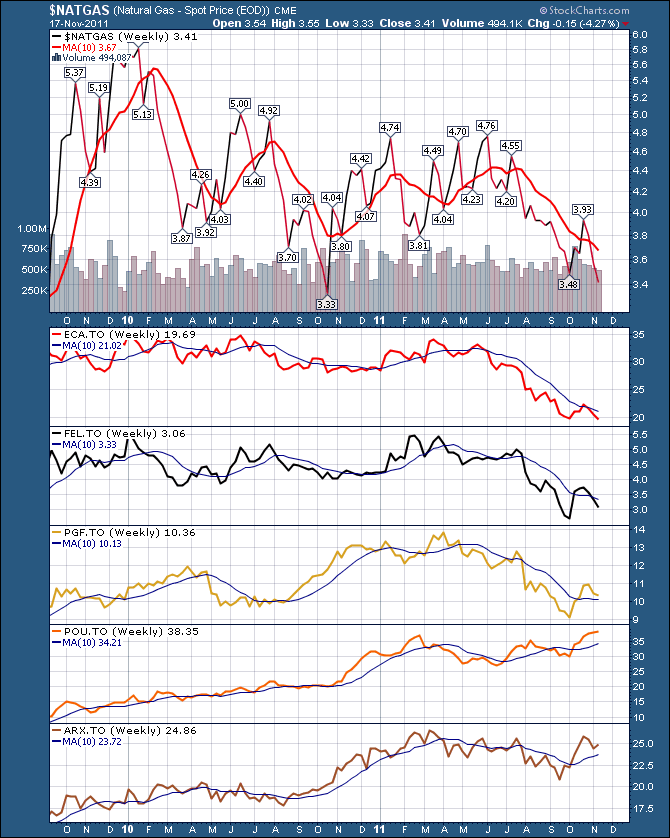
Here are some I think are Natural Gas. Does POU.TO belong here. At least we have a reason to go look.
Drillers
Fracing and service companies (This is Fracturing companies)
Lastly for this group, here are some high growth EP companies. (Fast little ones, can you tell by the charts which might be having trouble). Send me other ones to be included. Always happy to share some strong stocks.
Hopefully they can make us some money in the next upturn.
Lastly,
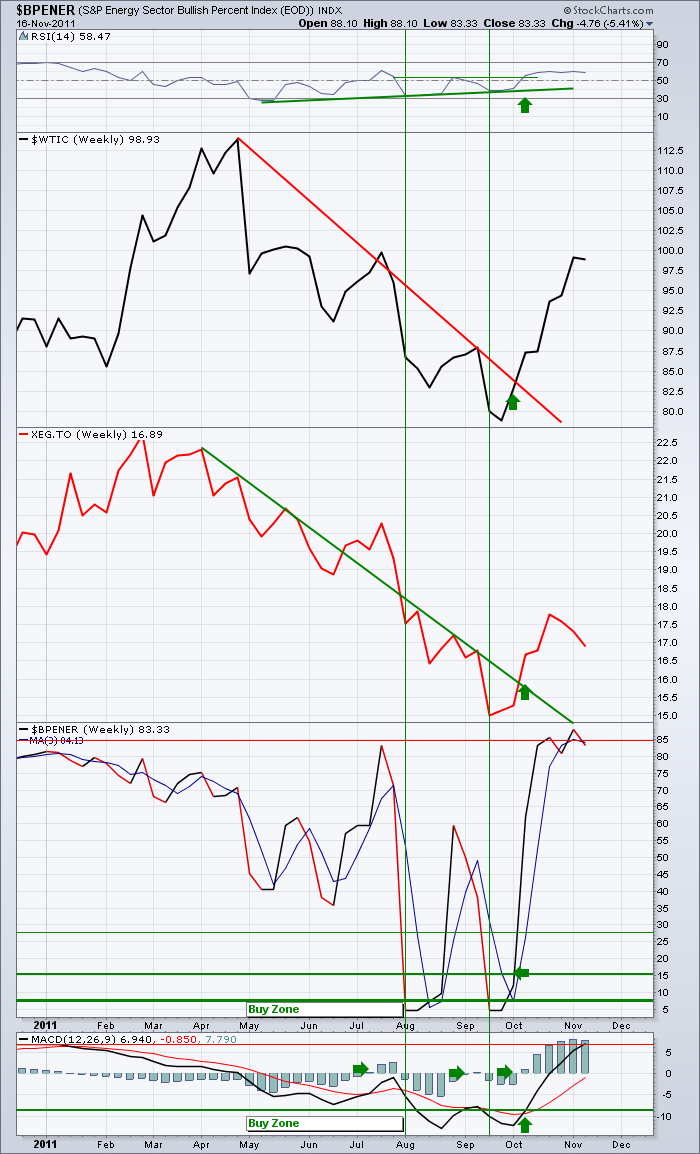
Here is a sell signal on my $BPENER chart. This is the number of stocks above the 50 DMA. When it crosses the 3 week MA its another signal. I never use it alone, but I sure like it when it confirms either way!
Without reference to oil....but popular to Canadians.
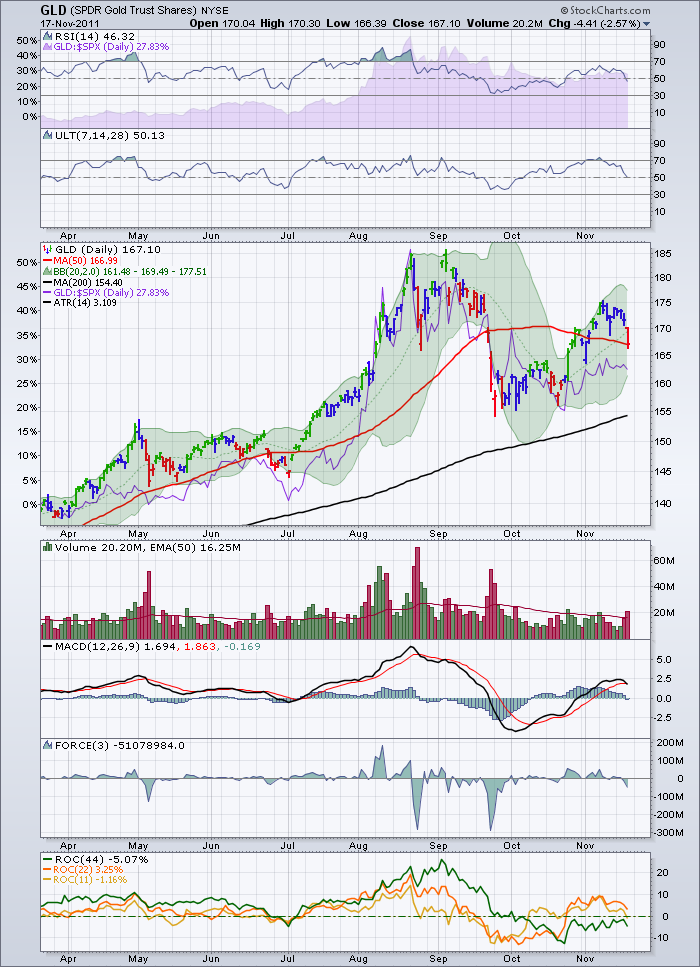
As an aside, GLD is testing it's 50 DMA today... ROC never got above zero...interesting times for this one.
One Final Piece. I got a great email from a fellow Canadian. He pointed me to his public chartlist on stockcharts.com that lists all the stocks in each industry sector. So rather than screen paste them in, I encourage you to go visit his blog. ALWAYS try to find time to go through the gems in the Public chartlist. More education there than any one text book.
Here is the link.
Canadian Public Chartlist All star!
Good Trading,
Greg Schnell, CMT

