Archived News
ChartWatchers6mo ago

SCTR Report: Vistra Energy Soars, Reaches New All-Time High
Utility stocks are now becoming cool. Going forward, AI companies will require massive power to amp up the innovative products and services they have in the pipeline. The amount of energy they need is way more than what's available in the traditional energy sources Read More
Stock Talk with Joe Rabil6mo ago

These 4 Chinese Stocks are Worth a Look
In this exclusive StockCharts TV video, Joe explains how to use two timeframes to identify 2 important characteristics of a great setup. For examples, he shares a few Chinese stocks that are showing great strength to the upside and what levels to watch for a pullback Read More
DecisionPoint6mo ago

With 2024 Q2 Earnings In, Market Remains Very Overvalued
S&P 500 earnings are in for 2024 Q2, and here is our valuation analysis Read More
Don't Ignore This Chart!6mo ago

Traders are Eyeing These Metals After China's Big Economic Shift: Here's What You Need to Know
China's central bank is back in action, cutting interest rates and lowering reserve requirements to boost its economy. Well, guess what? Metals are feeling it, big time. Gold prices hit a record high, and copper and silver prices saw huge surges due to high demand Read More
RRG Charts6mo ago

US Sectors Soar to New Highs!
In this video from StockCharts TV, Julius takes a detailed look at the monthly charts for all US sectors and the S&P 500. With many sectors breaking to new highs, he highlights how the long-term uptrend for the S&P 500 remains intact Read More
Members Only
Larry Williams Focus On Stocks6mo ago
Are Lower Interest Rates Bad For Workers? | Focus on Stocks: October 2024
ChartWatchers6mo ago
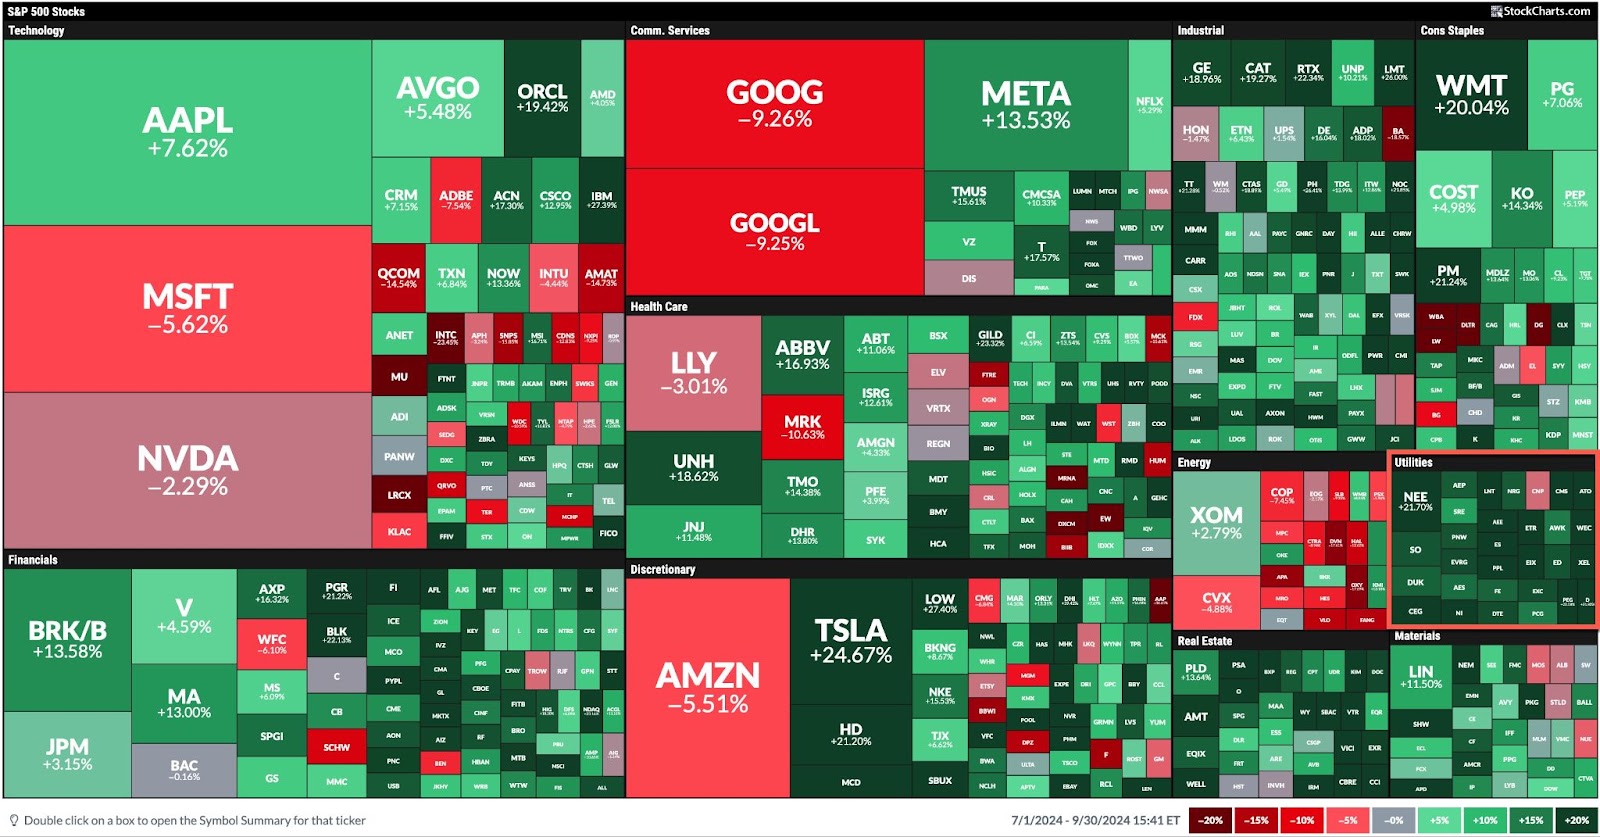
Stock Market's Spectacular Q3: Highest Sector Performer is Utilities
September, typically considered to be the weakest month for stocks, didn't turn out that way in 2024. We had a winning month—the S&P 500 eked out a higher close, and the S&P 500 ($SPX), Dow Jones Industrial Average ($INDU), and Nasdaq Composite ($COMPQ) had a positive quarter Read More
DecisionPoint6mo ago

DP Trading Room: Uncovering Stocks from DP Scan Alerts
In today's free DecisionPoint Trading Room, Erin pulls out her exclusive DecisionPoint Diamond Scans and finds us some new and interesting stock symbols to explore further. These scans are very powerful and bring the best charts to your attention Read More
GoNoGo Charts6mo ago

Equities Remain in Strong "Go" Trend as Communications Begin to Excel
Good morning and welcome to this week's Flight Path. Equities saw the "Go" trend remain strong with another uninterrupted week of strong blue "Go" bars. Treasury bond prices remained in the "Go" trend as well but we saw a whole week of weaker aqua bars. U.S Read More
Trading Places with Tom Bowley6mo ago

Can The China Strength Last Week Be Sustained?
China's Shanghai Composite Index ($SSEC) surged higher last week by roughly 13%, which was one of its largest 1-week gains over the past decade. There were solid economic reasons for the surge as China's central bank approved measures to accelerate recent sluggish growth Read More
The MEM Edge6mo ago

Why Were Chinese Stocks Up 20% Last Week?!
In this StockCharts TV video, Mary Ellen reviews the broader markets, including sector and industry group rotation, before highlighting the sharp move into Chinese stocks. She shares her thoughts on whether it's too late to participate Read More
ChartWatchers6mo ago

Stock Market Regains Bullish Edge: Can Geopolitical Tensions Change Its Direction?
There's one trading day left for the month of September. Unless something drastic happens over the weekend, the stock market looks like it has bucked the September seasonality pattern of being the worst trading month for equities Read More
Trading Places with Tom Bowley6mo ago

Could U.S. Stocks Crash In October?
That's a great question right now as many folks still remain quite nervous. The Volatility Index ($VIX), for example, gained more than 10% today, despite a minimal decline in the S&P 500. It's a signal that the stock market likely won't handle bad news very well Read More
The Mindful Investor6mo ago

Top Ten Charts to Watch for October 2024
As we near the end of what has been a fairly solid Q3 for the equity markets, we are left with the eternal question for investors: "What's next?" We now have the Fed's first rate cut in the rearview mirror, with multiple rate cuts expected into early 2025 Read More
DecisionPoint6mo ago

This Week's "Sector to Watch" and "Industry Group to Watch"
On Friday mornings in our DP Diamonds subscriber-only trading room, the DecisionPoint Diamond Mine, I like to look for a "Sector to Watch" and an "Industry Group to Watch" within. These are for your watchlist and not necessarily ready for immediate investment Read More
Don't Ignore This Chart!6mo ago

Unlocking GDX's Short-Term Potential: How to Nail the Measured Move Strategy
A few weeks back, two gold mining ETFs made it to the top 10 of the StockCharts Technical Rank (SCTR) Report, and they're still holding strong Read More
RRG Charts6mo ago

Opportunities in Industrials and Materials
Despite a backdrop of conflicting market signals, there are still sectors within the S&P 500 that are showing promising movements and potential opportunities for investors Read More
ChartWatchers6mo ago

SCTR Report: China Adds More Stimulus, FXI in Second Position
China's injection of additional fiscal stimulus into its economy injected more optimism into equity markets. This sent share prices of Chinese stocks exploding to the upside once again Read More
ChartWatchers6mo ago

China Stimulus Energizes Stocks, Commodities; Will The Energy Sink?
Tuesday's news from China pushed stocks, commodities, and crypto prices higher. China's central bank, the People's Bank of China (PBOC), took steps to revive its economy and increase consumer demand Read More
Stock Talk with Joe Rabil6mo ago

How to Use the ADX Indicator (Trend Strength Explained)
In this exclusive StockCharts TV video, Joe presents an introduction to the Average Directional Index (ADX), sharing how it is calculated and how to use it. He highlights some of the strengths, and weaknesses, of this powerful indicator Read More
Don't Ignore This Chart!6mo ago

How to Spot the Perfect Buying Opportunity in XLRE
The Fed's rate cuts set the real estate world abuzz, with lower mortgage rates giving homebuyers a little more breathing room. According to the Case-Shiller housing data released on Tuesday, home prices rose 5% in August Read More
RRG Charts6mo ago
Why the Stock Market is SO Confusing Right Now
In this video from StockCharts TV, Julius assesses current rotations in asset classes and US sectors using Relative Rotation Graphs, finding a lot of contradictory behavior Read More
Members Only
Martin Pring's Market Roundup6mo ago
The Dollar Index is Down, But Is It Out?
The Dollar Index has been selling off sharply in the last few weeks and has now reached critical support in the form of the lower part of its recent trading range. The big question is whether it will break below the range or extend it in any way Read More
DecisionPoint6mo ago

DP Trading Room: Analyzing Two New Stocks in SP500 (DELL, PLTR)
In today's free DP Trading Room Carl reviews the charts of two new members to the SP500, Dell (DELL) and Palantir (PLTR). Are they poised to break out on this news? Carl also discussed the inflation on housing prices to open the show Read More
GoNoGo Charts6mo ago

Equities Remain in Strong "Go" Trend, Powered by Financials
Good morning and welcome to this week's Flight Path. Equities saw the "Go" trend remain strong with an uninterrupted week of strong blue "Go" bars. Treasury bond prices remained in the "Go" trend as well but we saw weaker aqua bars as the week ended. U.S Read More
The Mindful Investor7mo ago

Bullish or Bearish? The Truth About Rate Cuts and Stock Performance
So the first Fed rate cut is behind us, and we are no longer in a "higher for longer" period, but in a new rate cut cycle which will most likely last well into 2025. So that's good news for stocks, right? Well, not necessarily Read More
The MEM Edge7mo ago

Strategy After Rate Cuts: Best Areas to BUY!
In this StockCharts TV video, Mary Ellen reviews the broader markets after last week's rate-cut induced rally. She also shares stocks that are breaking out of bases and poised to trade higher Read More
ChartWatchers7mo ago

Dow Jones in the Spotlight, Bonds Stabilize, Tech Plays Catch-Up
The Federal Reserve's interest rate cut decision on Wednesday was like receiving a gift from a wish list. When the rate cut was announced, the market initially rose, acting surprised by the decision. But the excitement fizzled off as the market closed lower on that day Read More
RRG Charts7mo ago

A Sector Rotation Dilemma ...
First of all, I apologize for my absence this week. I caught something that looked like Covid, and felt like Covid, but it did not identify (pun intended) as Covid. Apart from feeling lousy, also my voice was gone, so making a video was not a good idea Read More
DecisionPoint7mo ago

Analyzing Investor Sentiment for Gold
Sentiment indicators are contrarian, meaning that when the majority of investors are bullish on a market, it is bearish for that market Read More
ChartWatchers7mo ago
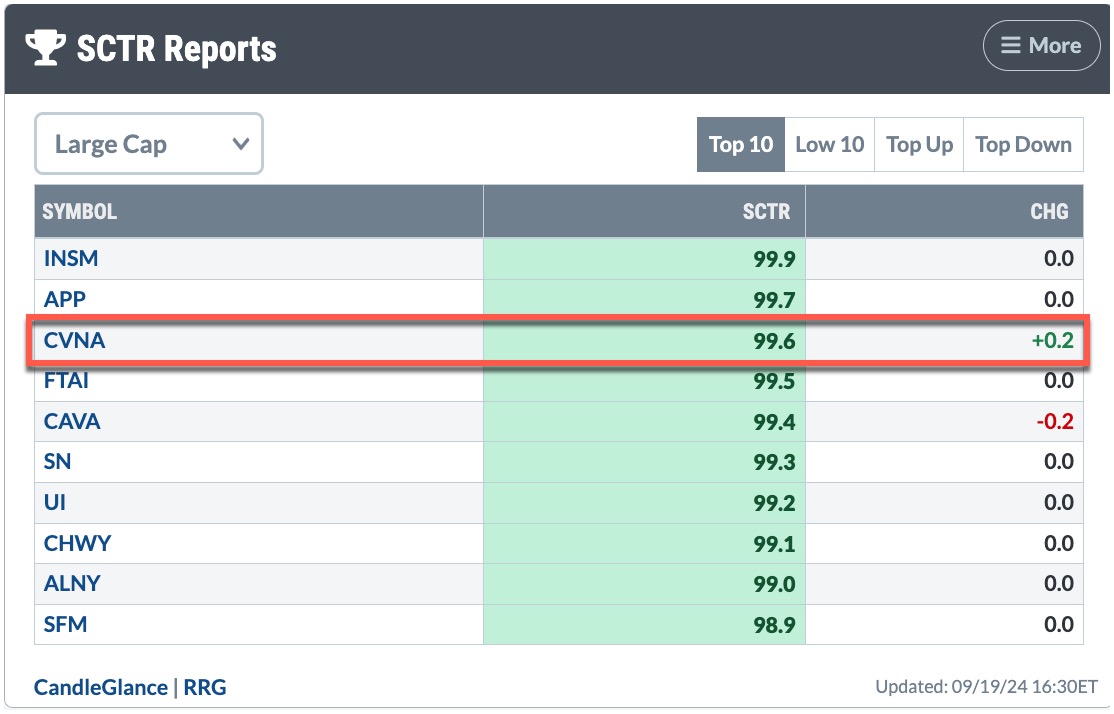
The SCTR Report: Carvana's Gain Makes It Worth a Revisit
On August 5, we featured Carvana (CVNA), which at the time took the top StockCharts Technical Rank (SCTR) spot for the Large Cap Top 10. The stock has pulled back since then, but is now gaining traction Read More
Don't Ignore This Chart!7mo ago

This S&P 500 Rally is Defying the Experts – Here's What You Need to Know
If you logged into the CNBC website on Thursday morning, you might have seen the headline, "Wells Fargo says don't buy this rally, fundamentals don't support it Read More
Members Only
Larry Williams Focus On Stocks7mo ago
The Fed Cut Discount Rate | Larry's "Family Gathering" September 19, 2024 Recording
ChartWatchers7mo ago

Stock Market Today: Fed Cuts Rates and Market Makes Last Minute U-Turn
The stock market received what it expected from the Federal Reserve—a 50 basis point interest rate cut. Stocks rose initially, but the broader stock indexes—Dow Jones Industrial Average ($INDU), S&P 500 ($SPX), and Nasdaq Composite ($COMPQ)—closed lower Read More
Stock Talk with Joe Rabil7mo ago

The Secret to Perfecting SPY Entry Points? RSI!
In this exclusive StockCharts TV video, Joe shows how to use RSI in multiple timeframes to identify the next buying opportunity in the SPY. Joe thinks this rally is important; he uses the ADX to distinguish between the strength in different indices Read More
Add-on Subscribers
OptionsPlay with Tony Zhang7mo ago
SHOP Stock Ready to Surge: An Options Strategy to Take Advantage of the Big Move
Shopify (SHOP) continues to show strong potential for growth, which is supported by fundamentals and technicals. As the broader e-commerce market expands, SHOP is well-positioned to capture additional market share from rivals such as Amazon Read More
ChartWatchers7mo ago

Investors Hesitant Ahead of Fed Meeting: How to Prepare
The broader stock market indexes are still in a holding pattern as investors await the Fed's decision on Wednesday. Tuesday's price action was a little like a "Whac-a-Mole" game for the S&P 500 ($SPX) and Nasdaq Composite ($COMPQ) Read More
Don't Ignore This Chart!7mo ago

How High Can Gold Prices Go? The Tools You Need to Spot the Next Big Breakout!
As of Tuesday, the CME's FedWatch Tool gave a 67% chance of a 50 basis-point rate cut—way up from the 25-point cut everyone was betting on just days ago Read More
DecisionPoint7mo ago

DP Trading Room: Tracking Gold Sentiment
As part of Carl's review of Gold charts, he explained how we use the close-ended fund, Sprott Physical Gold Trust (PHYS) to measure sentiment for Gold. Depending on how PHYS trades, it trades at a discount or premium based on the physical Gold that it holds Read More
Popular Articles

This is the Group to Watch for the Next Bull Market Phase and Separating Noise from Reality

When in Doubt, Follow the Leadership

200-Day Moving Average Confirms Bearish Phase

An Oversold Bounce is One Thing - A Bullish Breadth Thrust is Another

Stay Ahead of the Stock Market: Key Bond Market Signals Explained with Charts

Is This the Confidence Trap That Could Wreck Your Retirement Portfolio?
Get expert technical commentary delivered straight to your inbox! Sign up for our FREE weekly ChartWatchers Newsletter. Learn More
Featured Authors


Public ChartList Leaders


StockCharts Members unlock complete access to the Stocks & Commodities Magazine archives. Read the latest articles or browse past editions.