Archived News
Don't Ignore This Chart!7mo ago

How High Can Gold Prices Go? The Tools You Need to Spot the Next Big Breakout!
As of Tuesday, the CME's FedWatch Tool gave a 67% chance of a 50 basis-point rate cut—way up from the 25-point cut everyone was betting on just days ago Read More
DecisionPoint7mo ago

DP Trading Room: Tracking Gold Sentiment
As part of Carl's review of Gold charts, he explained how we use the close-ended fund, Sprott Physical Gold Trust (PHYS) to measure sentiment for Gold. Depending on how PHYS trades, it trades at a discount or premium based on the physical Gold that it holds Read More
GoNoGo Charts7mo ago

Equity Markets Rebound As Discretionary Out-Performs
Good morning and welcome to this week's Flight Path. Equities saw the "Go" trend return after a triplet of uncertain "Go Fish" bars. We saw blue "Go" bars from Wednesday on. Treasury bond prices remained in a strong "Go" trend painting blue bars the entire week. U.S Read More
Trading Places with Tom Bowley7mo ago

Can We Trust Last Week's BIG Rally?
That's a great question, because we saw some very nice gains and we're now approaching all-time highs, especially on the Dow Jones ($INDU) and S&P 500 ($SPX). The more growth-oriented NASDAQ 100 ($NDX) has much more work to do Read More
Art's Charts7mo ago

An Indicator to Reduce Whipsaws and Ride Trends
Whipsaws and losing trades are part of the process for trend-following strategies. These are expenses, and simply unavoidable. Over time, trend-following strategies will catch a few big trends and these profits will more than cover the expenses Read More
The MEM Edge7mo ago

These Stocks are Just Beginning Their Move Higher!
In this StockCharts TV video, Mary Ellen reviews the broader markets and highlights pockets of strength that are starting to trend higher Read More
The Mindful Investor7mo ago
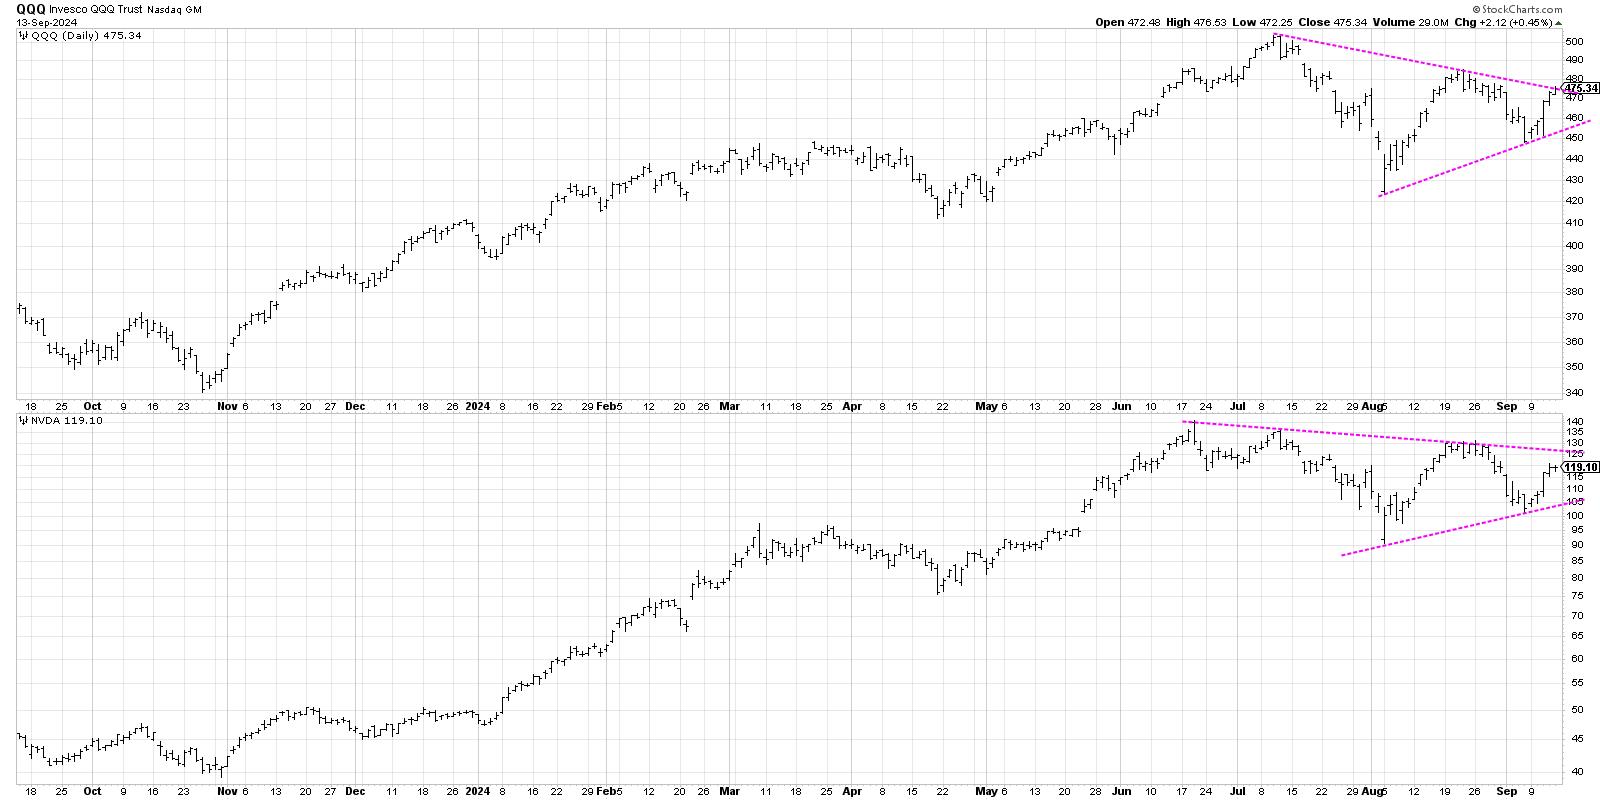
Here's My Most-Likely Scenario for QQQ
While the S&P 500 finished the week once again testing new all-time highs around 5650, the Nasdaq 100 remains rangebound in a symmetrical triangle or "coil" pattern Read More
ChartWatchers7mo ago
A Half Point Fed Rate Cut? The Stock Market Thinks So
This week's stock market action may have caught many investors by surprise. After last week's massive selloff, this week's turnaround reignited investor enthusiasm in equities Read More
Members Only
Larry Williams Focus On Stocks7mo ago
Larry's LIVE "Family Gathering" Webinar Airs NEXT WEEK - Thursday, September 19 at 2 PM EDT!
RRG Charts7mo ago

A Déjà Vu in The Consumer Staples Sector Sends a Strong Warning Signal
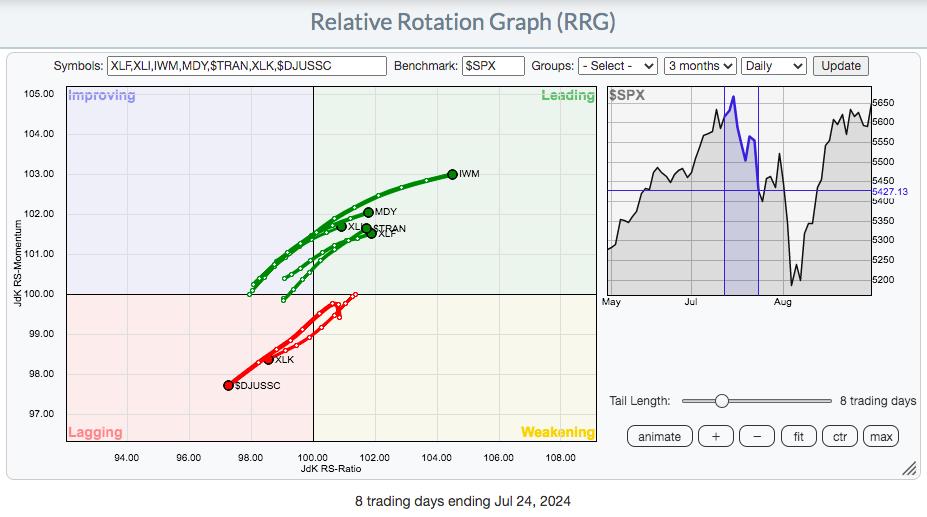
Tech Rallies, But Remains Inside the Lagging Quadrant A quick look at the Relative Rotation Graph for US sectors reveals that the Technology sector is still the main driving force for the market Read More
Don't Ignore This Chart!7mo ago
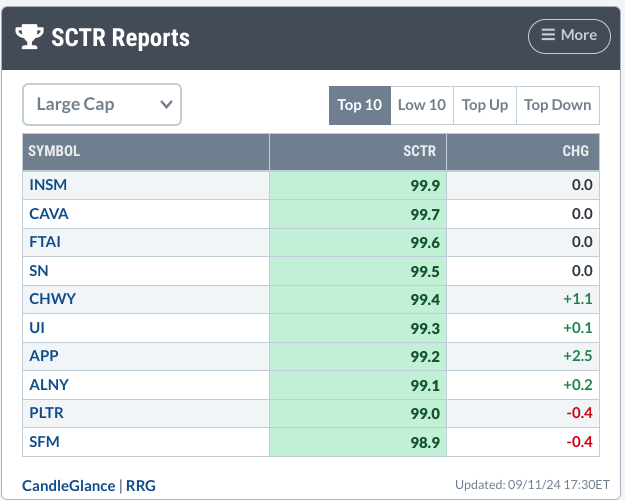
The SCTR Report: Insmed's Stock Hangs in the Balance—Here's What You Need to Know
Numerous companies are making strides within their respective sectors, but, unless you follow the sector closely, you might not be aware of them. That's what makes StockCharts Technical Rank (SCTR) reports so helpful Read More
ChartWatchers7mo ago
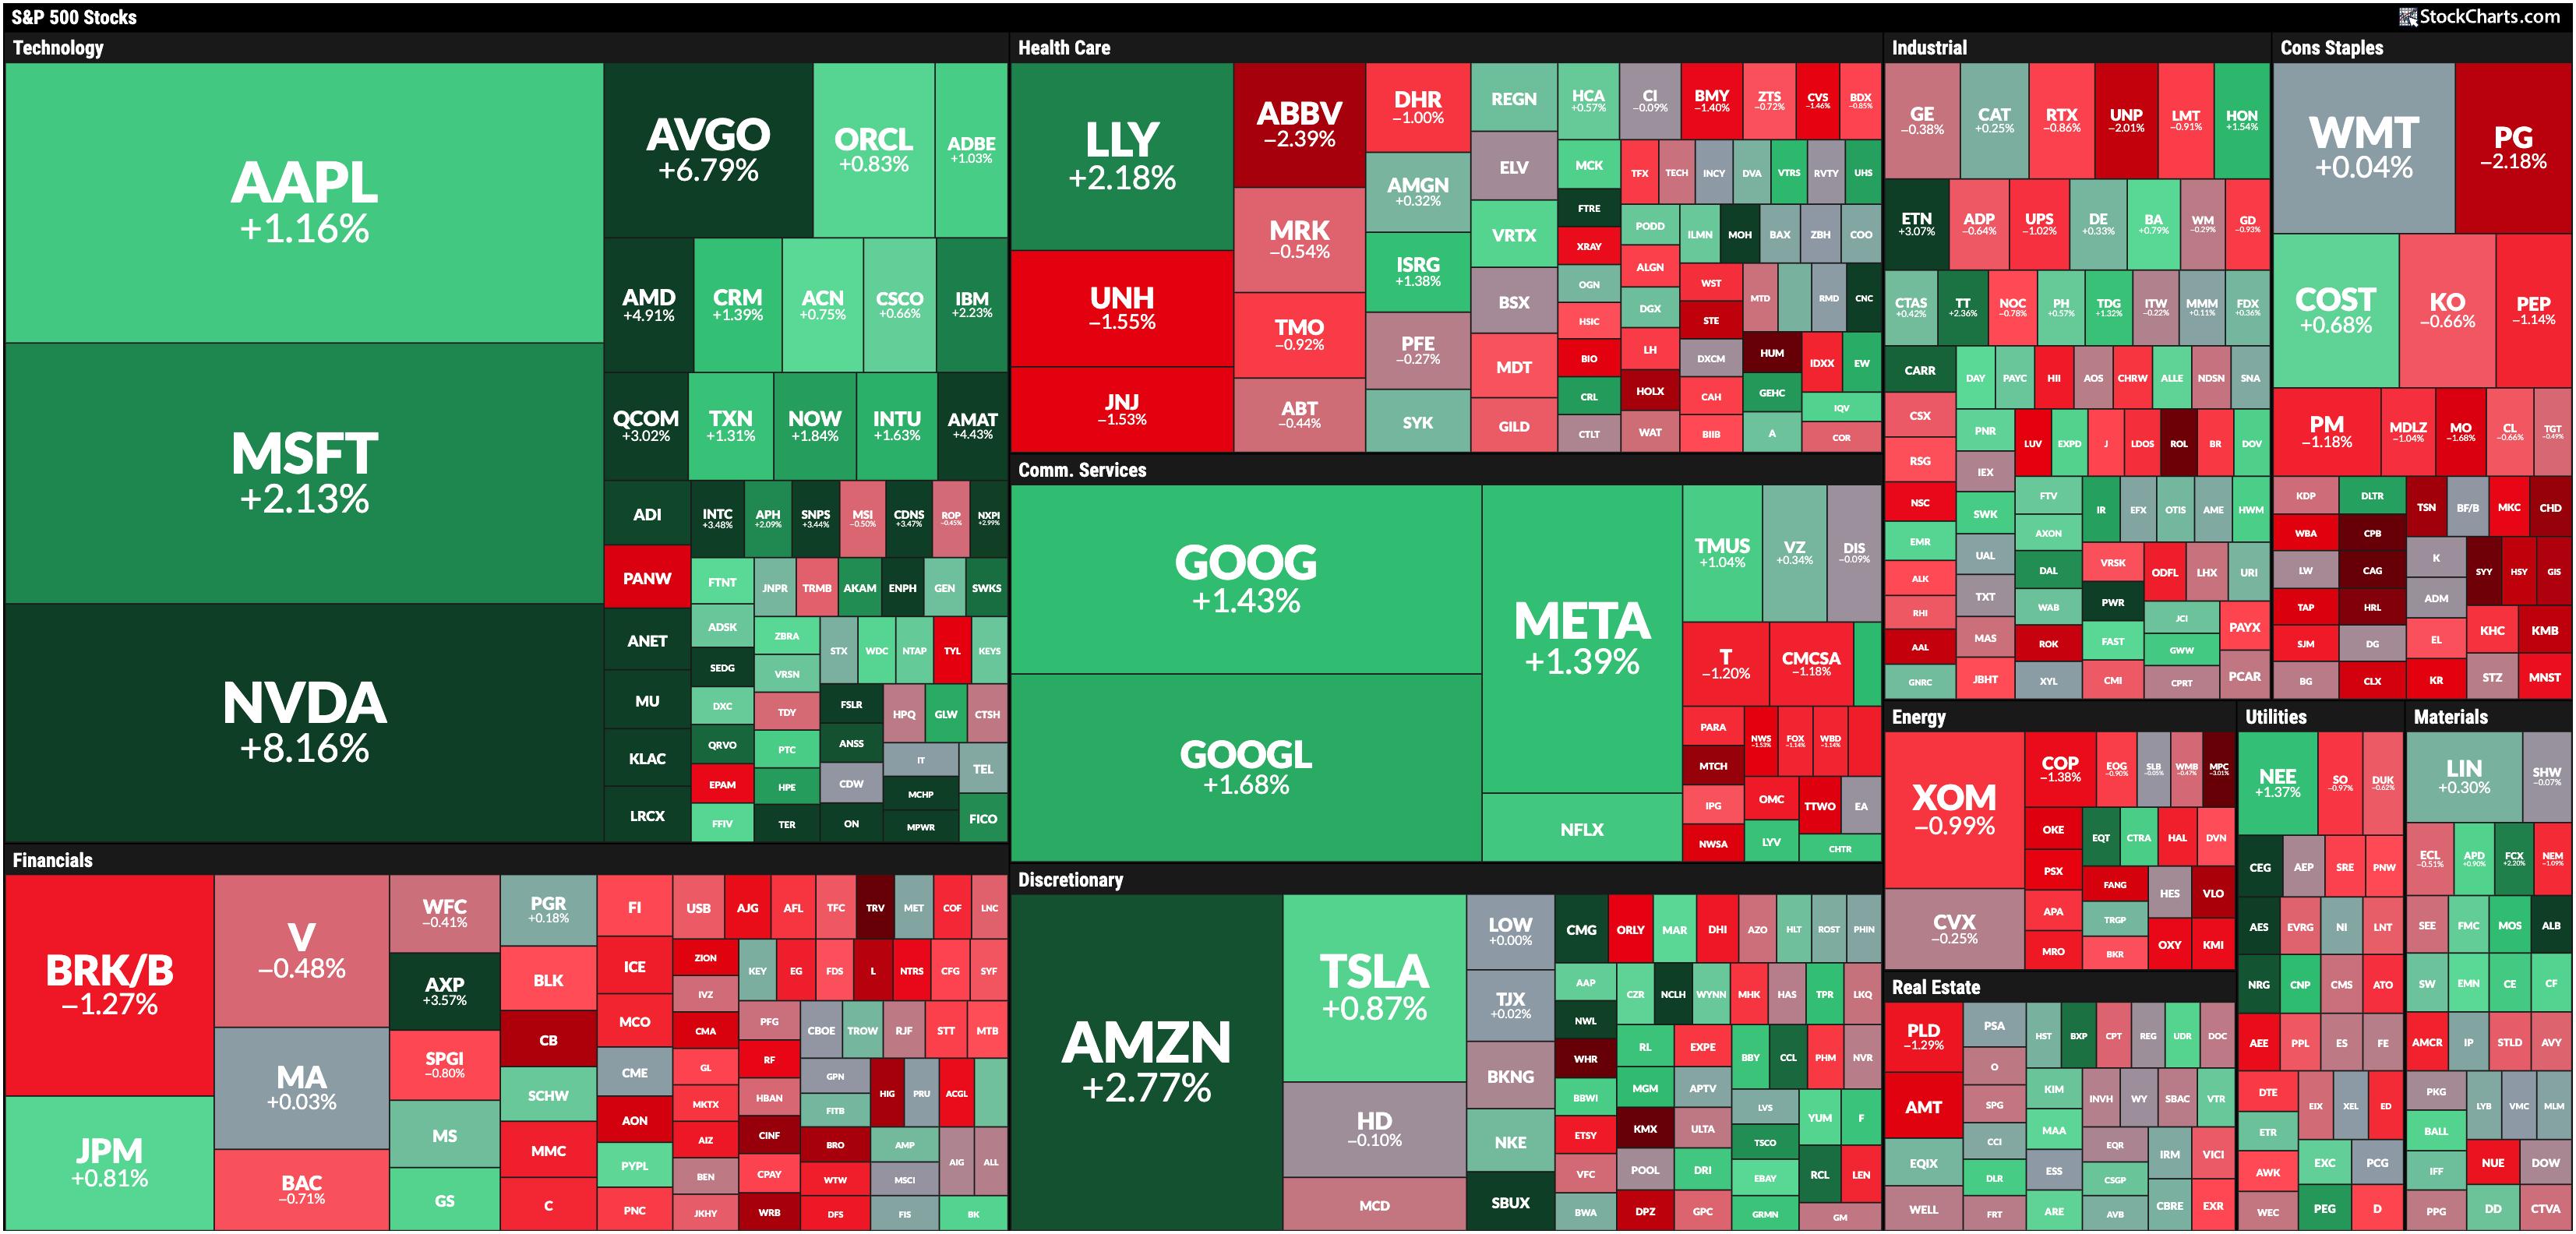
Stock Market Today: Are Big Tech Growth Stocks Back in the Spotlight?
It was a massive turnaround day in the market on Wednesday—stocks sold off after the Consumer Price Index (CPI) data was released, but, after a couple of hours, rallied back to make up the losses and continue higher. The broader stock market indexes closed higher Read More
Stock Talk with Joe Rabil7mo ago

Pinpoint Strong Sectors BEFORE The Masses Notice
In this exclusive StockCharts TV video, Joe discusses why he is a bottom-up technical analyst Read More
RRG Charts7mo ago

Why Stock Outperformance Might be ENDING!
In this video from StockCharts TV, Julius takes a look at rotations in an asset allocation RRG. He compares fixed-income-related asset classes, commodities, the US dollar, Bitcoin and stocks to a balanced portfolio of 60% stocks/40% bonds Read More
ChartWatchers7mo ago
Stock Market Today: Real Estate and Tech Lead, Energy Down
The Real Estate sector took the lead in Tuesday's trading, probably because interest rate cuts are approaching. Technology and Consumer Discretionary took second and third place, respectively Read More
Don't Ignore This Chart!7mo ago

Biotech's Big Comeback: Why Investors are Eyeing This Beaten-Down Sector
Perhaps no other industry in the world is more synonymous with risk and emergent (R&D) developments like biotechnology Read More
DecisionPoint7mo ago

DP Trading Room: AI Bubble Deflating
The recent decline last week revealed that the artificial intelligence bubble is deflating. Magnificent Seven stocks are unwinding in response to investors losing confidence in the AI trade in general Read More
GoNoGo Charts7mo ago

Equities Say "Go Fish"; How "Healthy" are the Markets?
Good morning and welcome to this week's Flight Path. Equities flashed an uncertain "Go Fish" bar at the end of the week as the markets became even more unsettled. Treasury bond prices remained in a "Go" trend and saw that trend was strong for almost all of last week. U.S Read More
Art's Charts7mo ago

Market Timing for a Rules-Based Strategy
Any strategy that trades stocks needs some sort of market timing mechanism to identify bull and bear markets. Typically, stock strategies are fully invested during bull markets because risk is acceptable. Strategies move to cash during bear markets because risk is above average Read More
Trading Places with Tom Bowley7mo ago

September: Exit Light, Enter Night
Much like the southeastern portion of the U.S. frets over the potential of devastating hurricanes, stock traders and investors brace for their own financial hurricane this time of year Read More
Members Only
Martin Pring's Market Roundup7mo ago
Four Intermarket Confidence Relationships that Aren't Confident
Most of the primary trend indicators I follow are in a bullish mode and show few signs of flagging. That said, some intermarket relationships, which help to indicate whether the environment is risk-off or risk-on, have started to move in a risk-off direction Read More
Analyzing India7mo ago
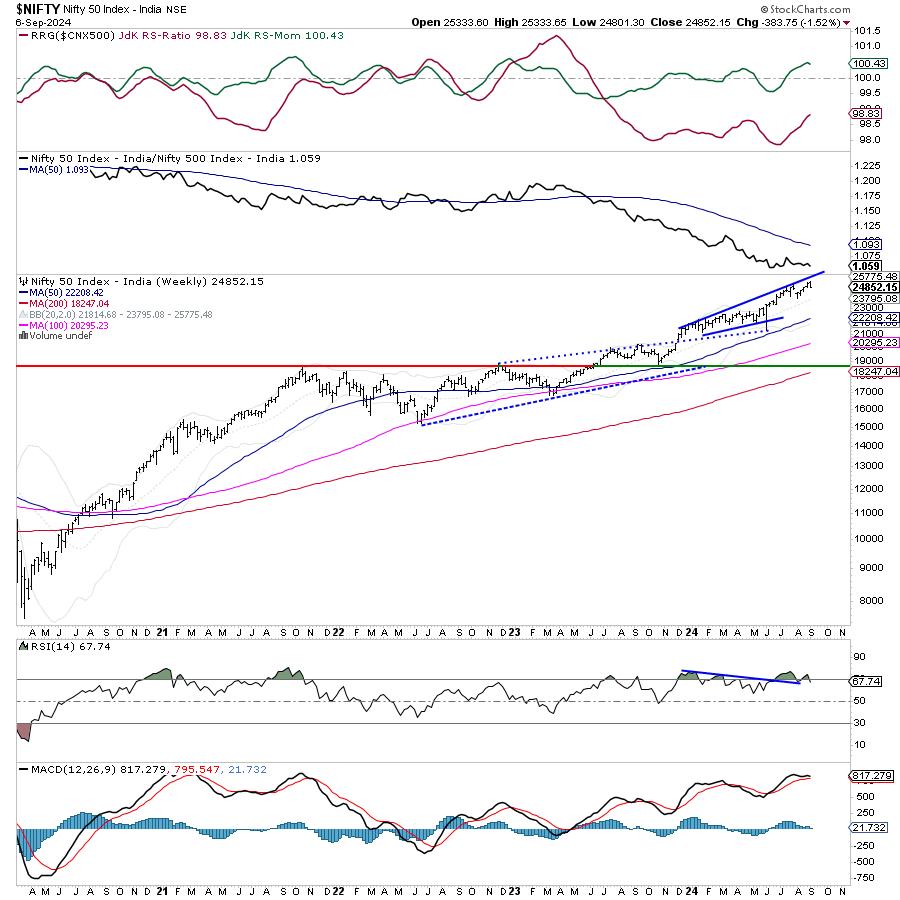
Week Ahead: NIFTY Shows Early Signs of a Likely Disruption of Uptrend; Tread Cautiously
After initially forming a fresh incremental lifetime high, the markets succumbed to selling pressure from higher levels after spending some indecisive sessions during the week Read More
The Mindful Investor7mo ago
Three Charts Screaming Market Top
This week, the market appeared to shift dramatically from "stalling out at all-time highs" to more of a "big time risk-off selloff move" kind of situation. The warning signs were building in August, but, so far, September is ringing all kinds of market topping alarm bells Read More
The MEM Edge7mo ago
Markets Nosedive Amid Recession Fears
In this StockCharts TV video, Mary Ellen reviews the current downtrend taking place in the S&P 500 and Nasdaq, and highlights the "uninverting" yield curve. She finishes with a deep dive into Nvidia, sharing how to handle the stock depending on your investment horizon Read More
ChartWatchers7mo ago
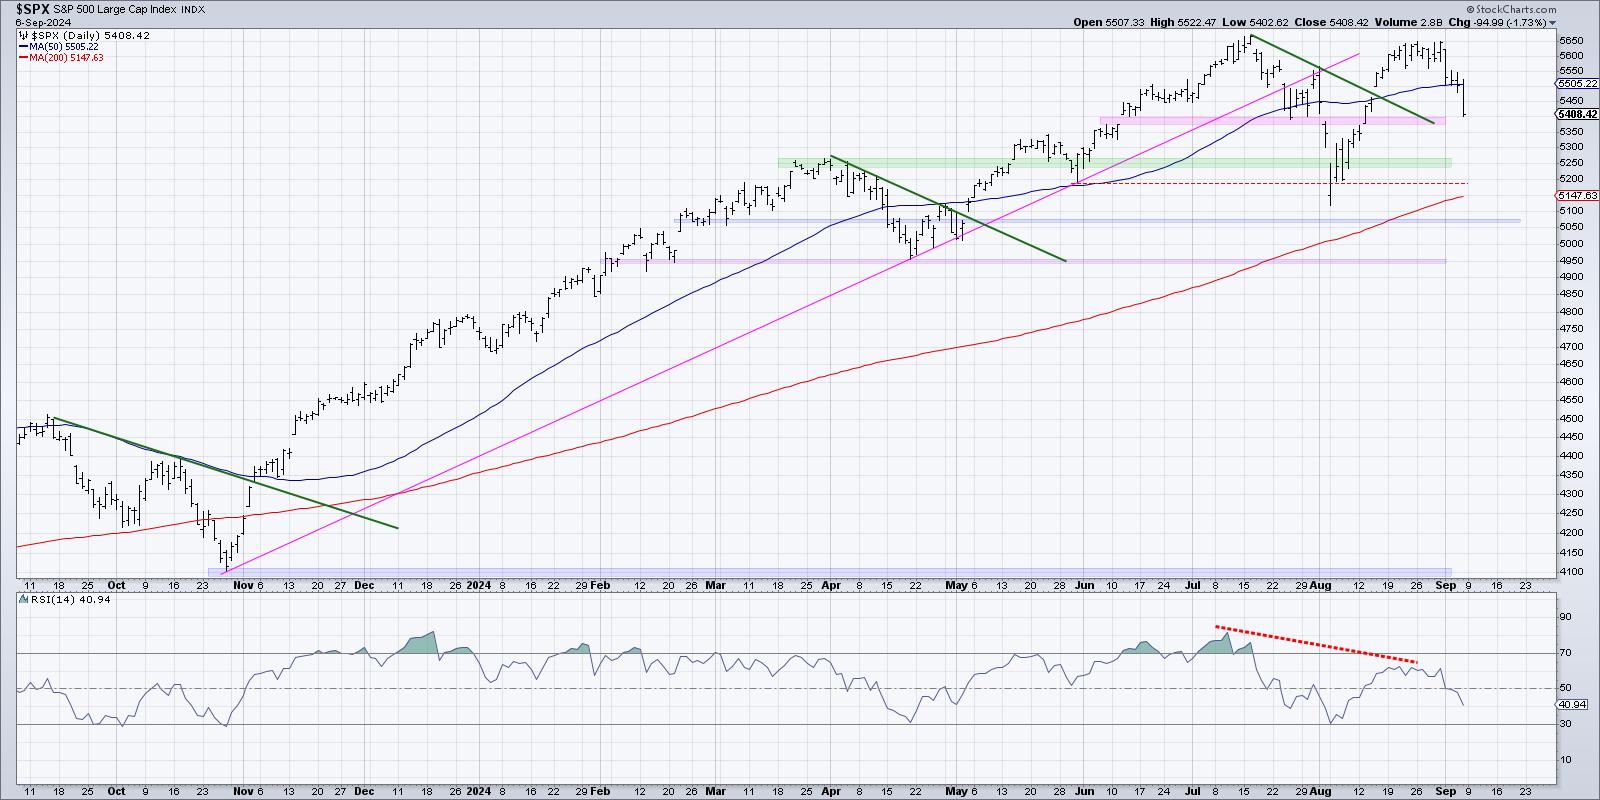
Broad-Based Stock Market Selloff: How to Position Your Portfolio?
After a week of wavering action, the stock market made a directional move—a lot lower—after Friday's jobs data. Investors are concerned about the economy, and the narrative has switched from inflation worries to thinking that perhaps the Fed is too late in cutting rates Read More
DecisionPoint7mo ago
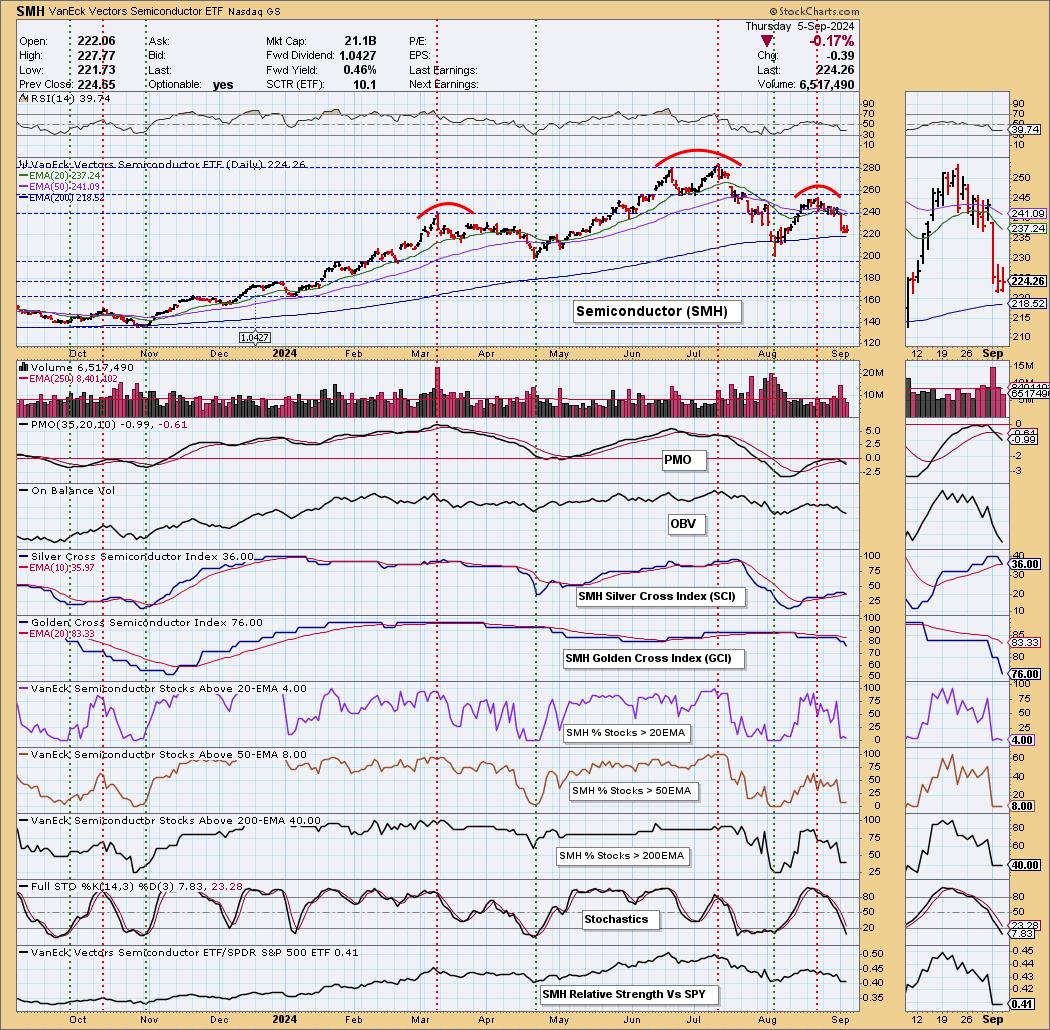
Intermediate-Term Bearish Head & Shoulders on Semiconductors (SMH)
We are always on the lookout for chart patterns. Recently, we've found a bearish head-and-shoulders developing on Semiconductors (SMH). Looking at the daily chart below, we can see the pattern developing. However, we do have to point out participation Read More
DecisionPoint7mo ago
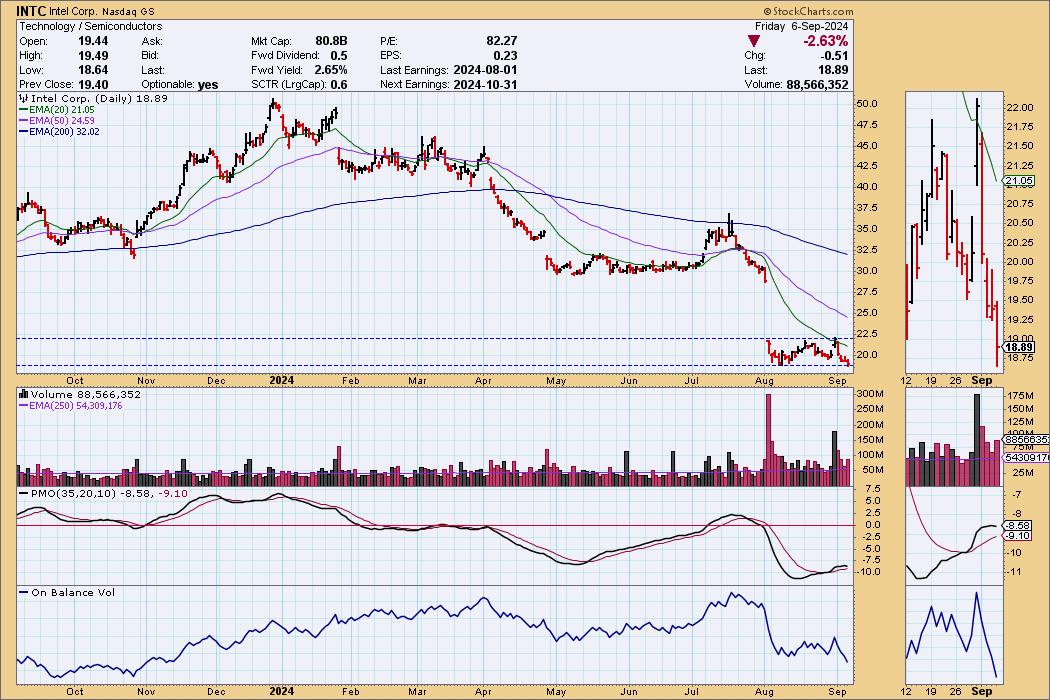
Is It Time to Buy Intel?
I've been around long enough to remember when Intel (INTC) was the NVIDIA of the day. Now, INTC is under severe pressure, having suspended its dividend, and is currently being considered for removal from the Dow 30 Industrial Average Read More
ChartWatchers7mo ago
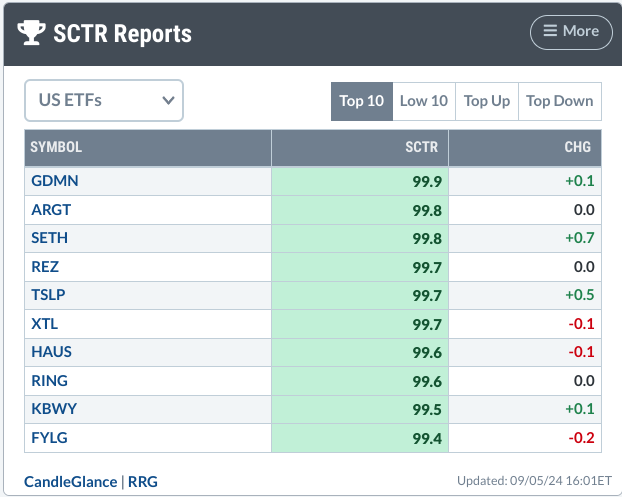
How to Spot a Golden Mining Opportunity Using SCTR Reports
On Thursday afternoon, I dove into the StockChartsTechnicalRank (SCTR) Reports to scout out a good ETF during a mixed market (Dow and S&P 500 were down, Nasdaq was up) Read More
Don't Ignore This Chart!7mo ago
The SCTR Report: Why TSLA Stock Sees Tremendous Strength
When the stock market is hobbling along, trying to determine whether the recent jobs and manufacturing data are good or bad for the economy, it's easy to miss some of the stocks that could make intermediate-term profitable returns Read More
Stock Talk with Joe Rabil7mo ago
The Best Reversal Patterns (Trading Strategy Explained)
In this exclusive StockCharts TV video, Joe shares how he identifies and trades a reversal pattern Read More
Wyckoff Power Charting7mo ago

S&P 500 Tempest in a Teapot
As we have discussed many times, financial markets are fractal. Different timeframes produce similar price structures. This is a very valuable phenomena for the study and practice of trading Read More
Don't Ignore This Chart!7mo ago

How to Spot a Hedge Fund Trap: MicroStrategy's Dramatic Plunge
In early 2024, MicroStrategy (MSTR) became a meme stock favorite thanks to its close ties to Bitcoin. If you rode the hype to its peak in March, hopefully you cashed out before hedge funds began shorting it heavily and going long Bitcoin instead Read More
ChartWatchers7mo ago
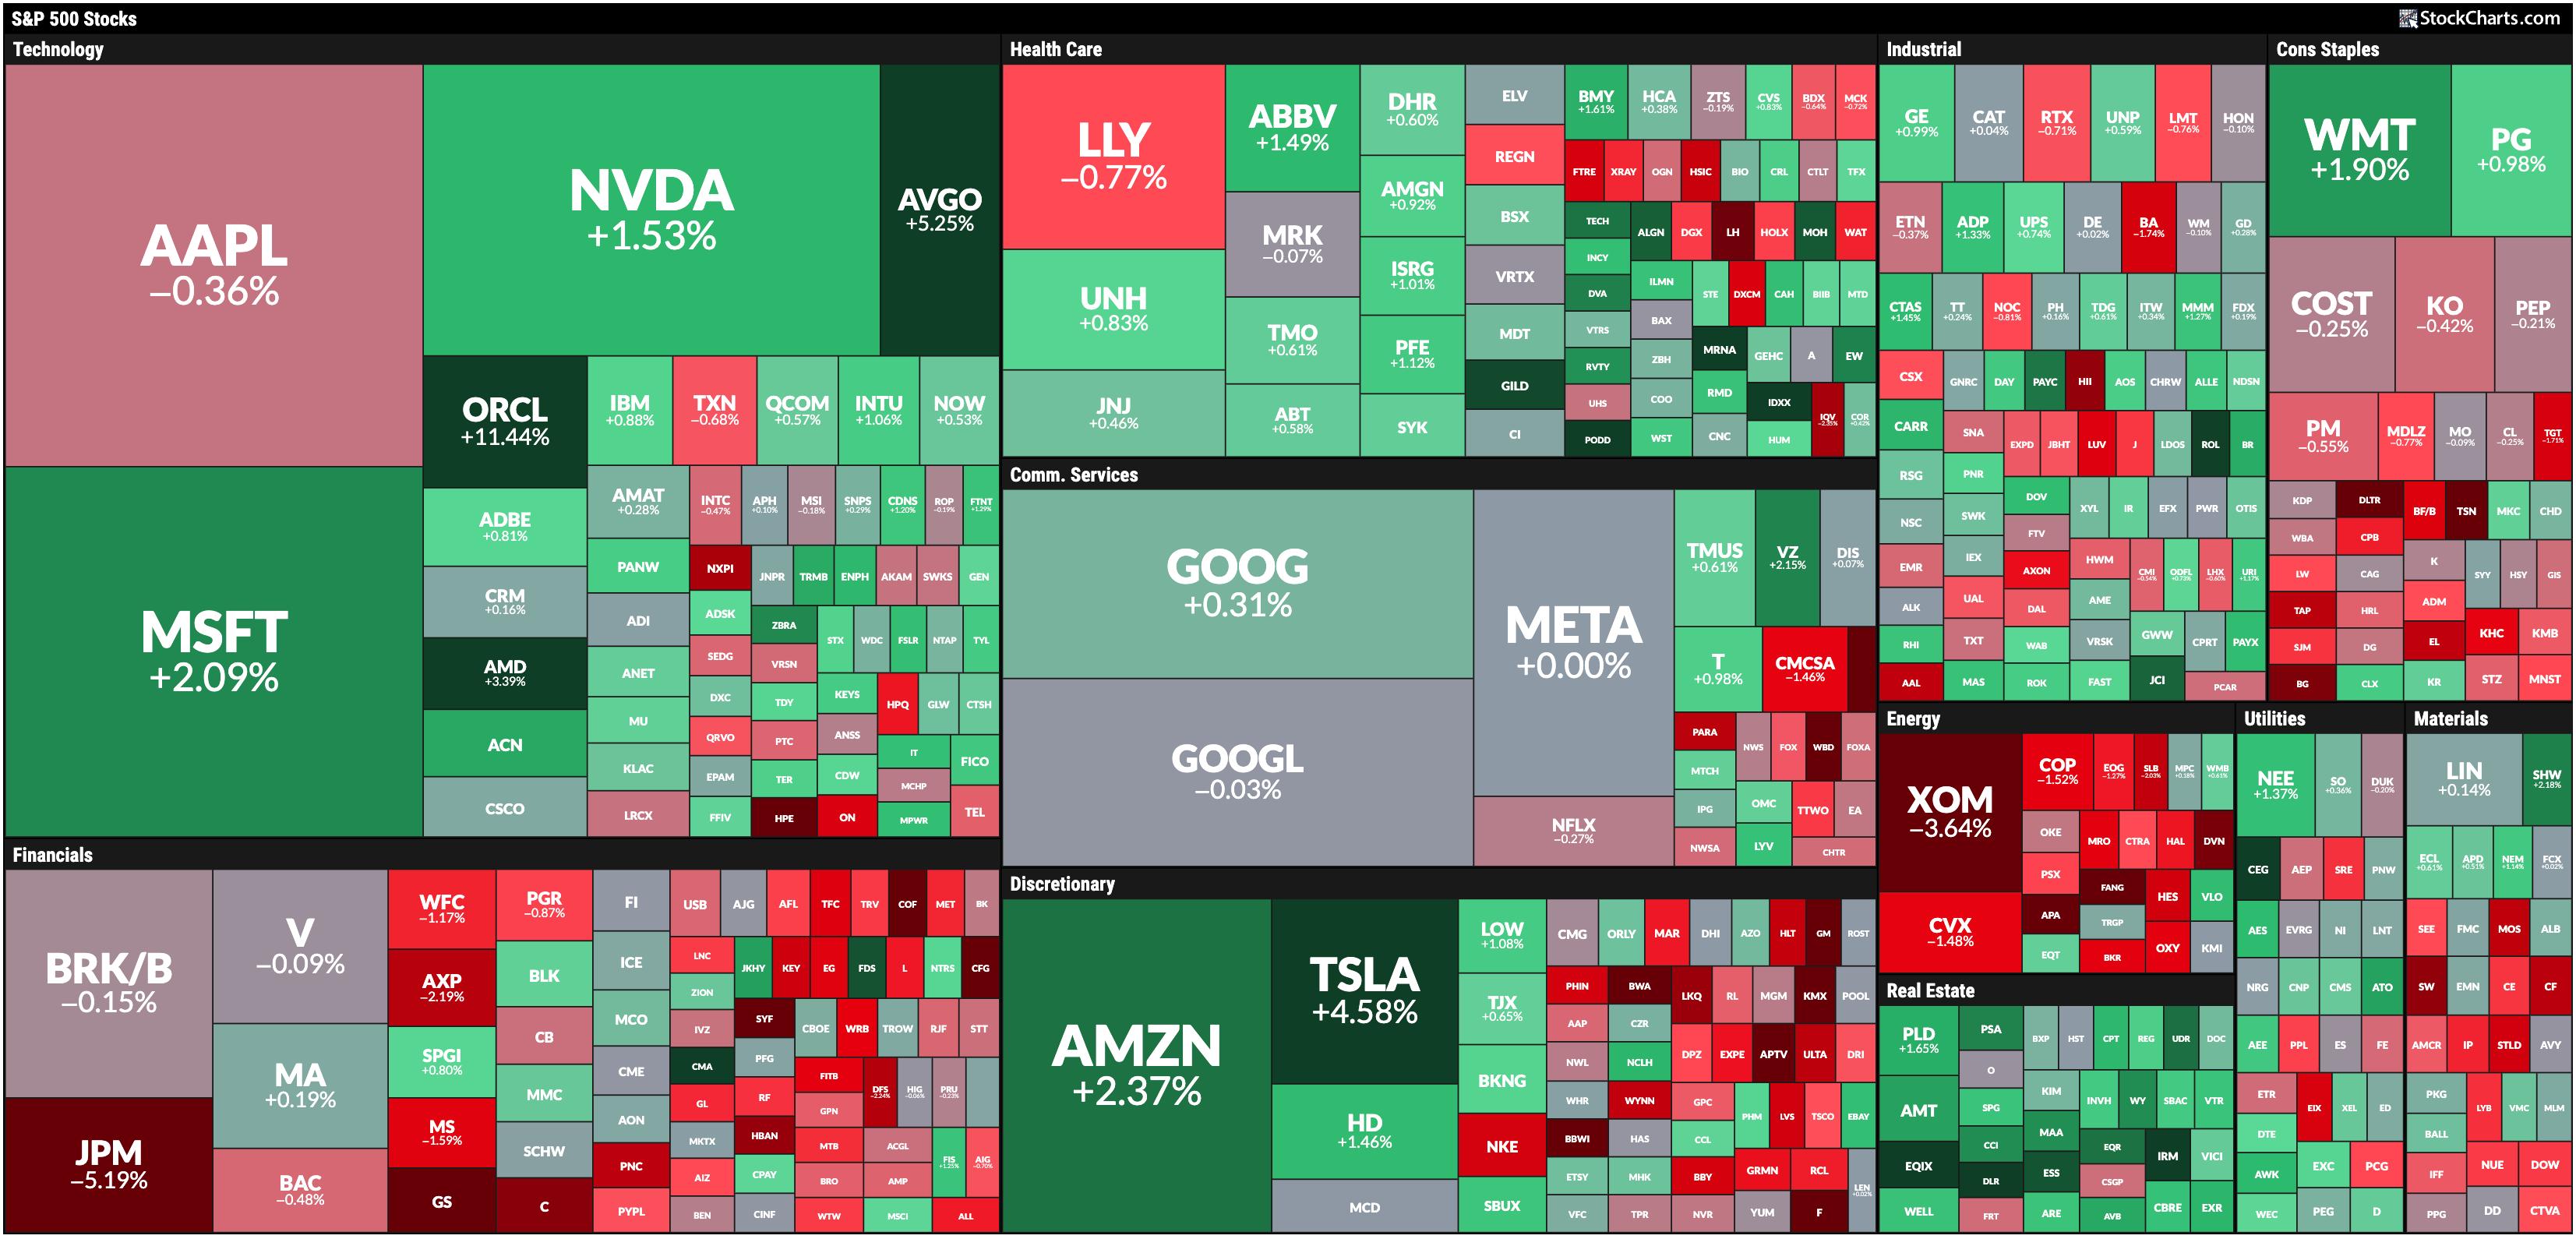
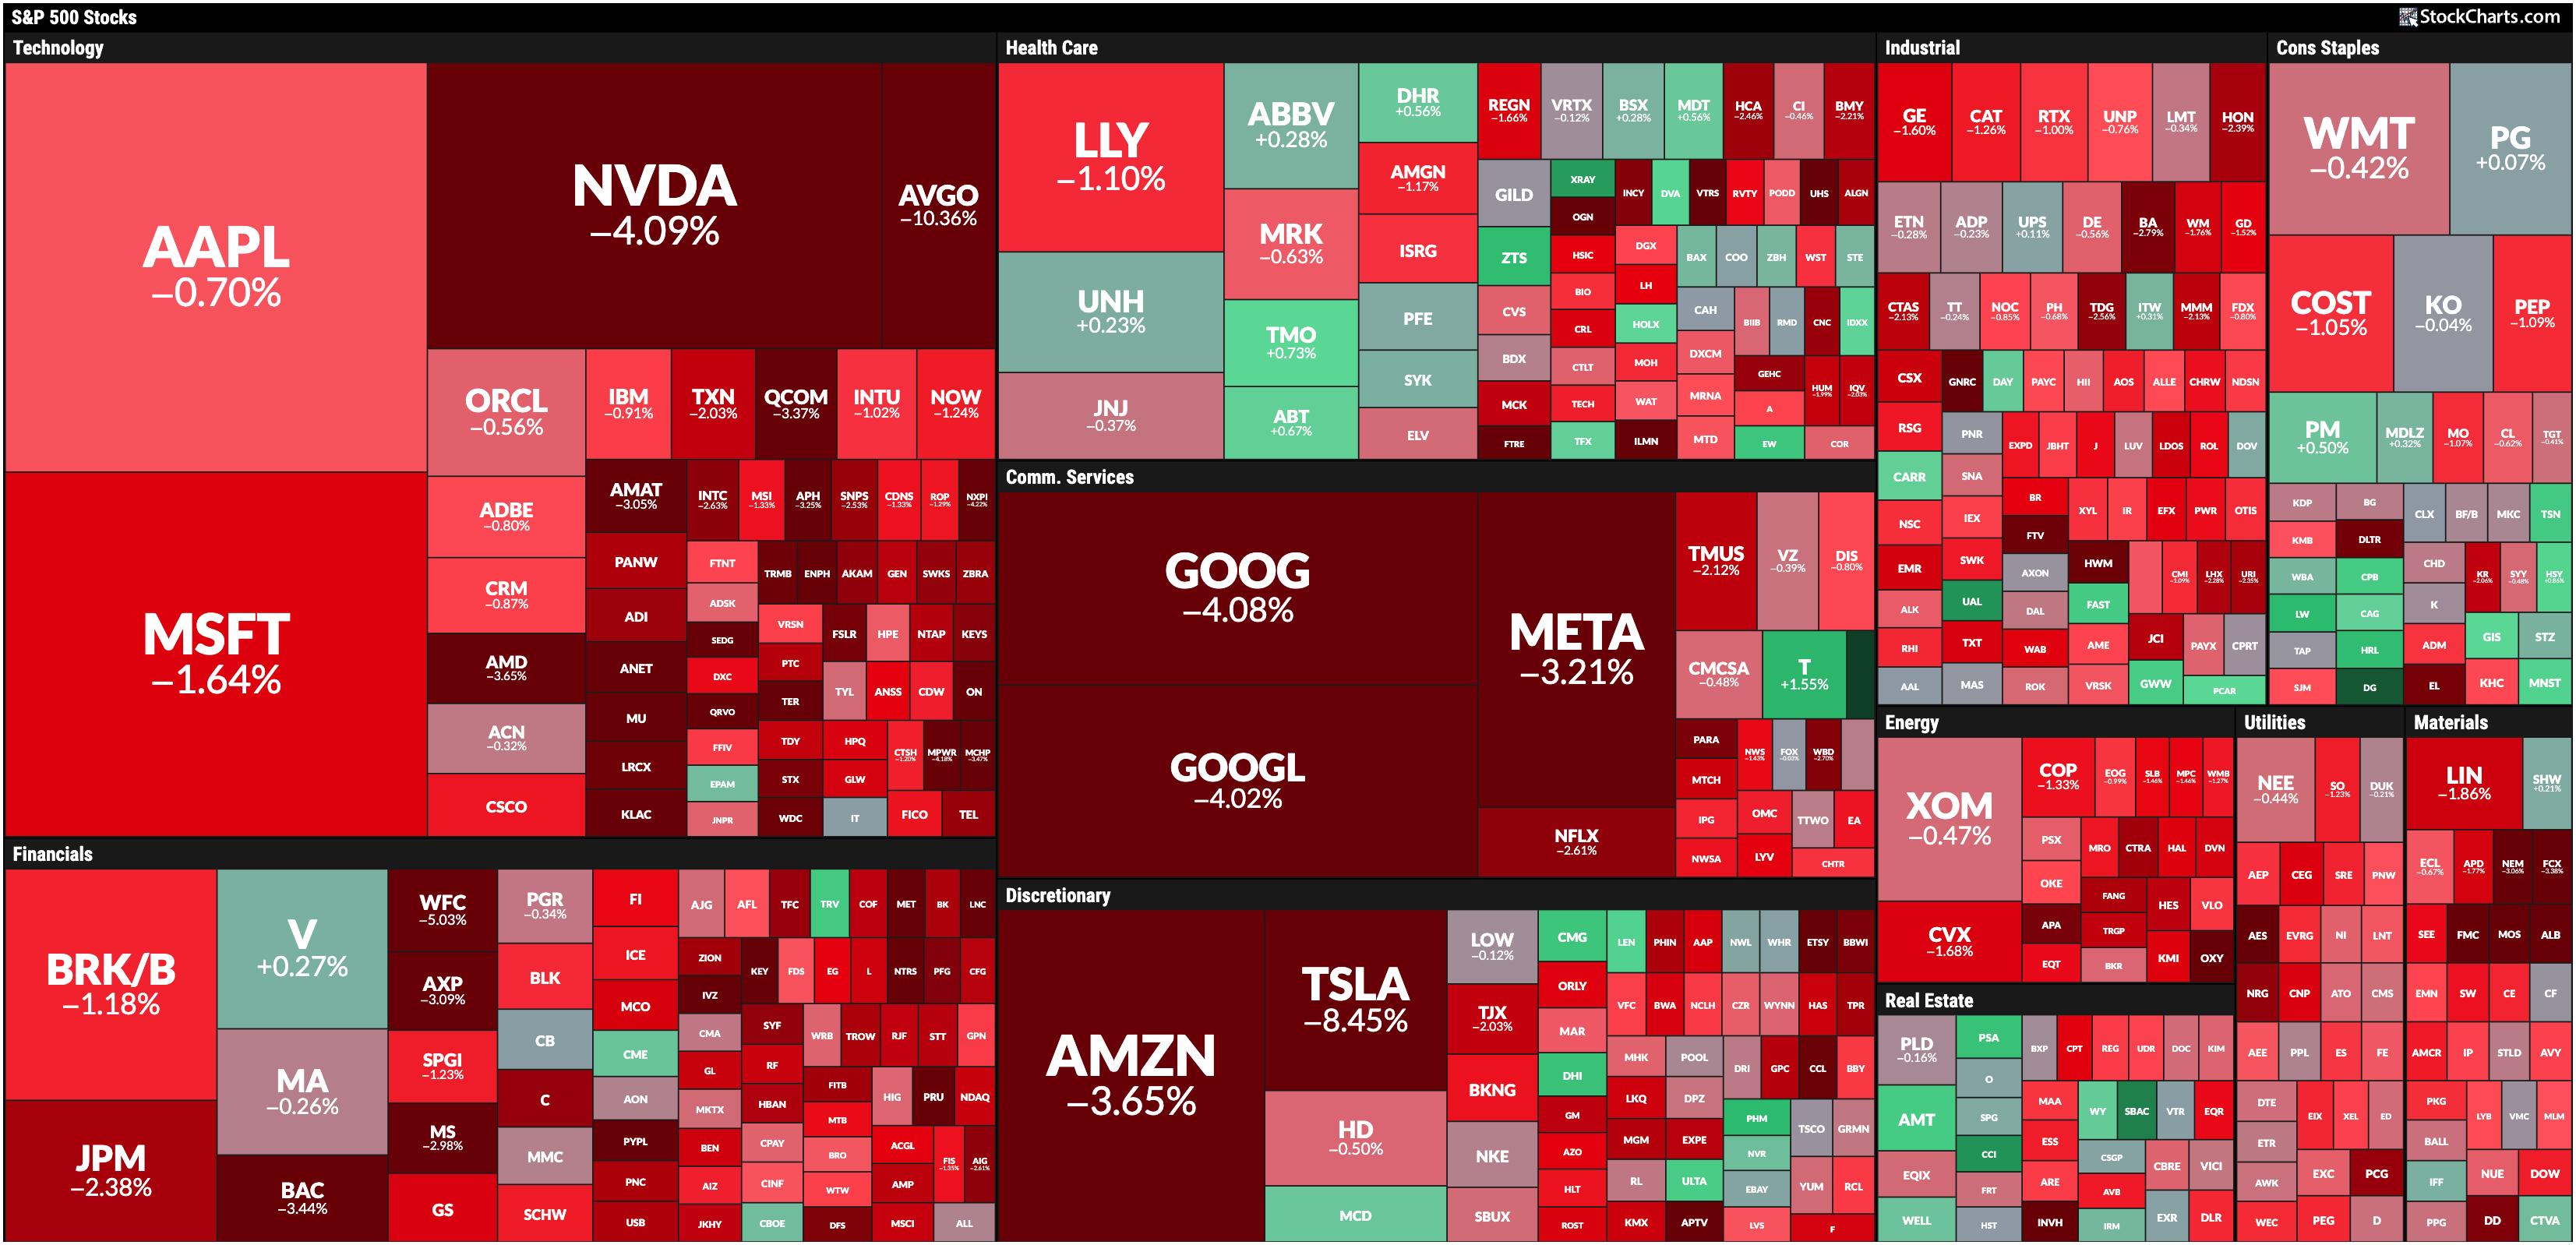
Stock Market Today: Tech Tumbles as Mega-Cap Stocks Get Hit by Major Profit-Taking
I hope you had a relaxing, restful long weekend, and welcome to September. It was a pretty dismal post-Labor Day trading session. We all know September is the worst for stocks, but let's hope the first day's action doesn't foretell how the rest of it will play out Read More
RRG Charts7mo ago
Why the S&P 500 Going Sideways is the Best Case Scenario
In this video from StockCharts TV, Julius evaluates the completed monthly charts for August, noting the strength of defensive sectors. He then analyzes a monthly RRG and seeks alignment for the observations from the price charts Read More
Members Only
Martin Pring's Market Roundup7mo ago
Is It Inflation or Deflation? What's in Your Wallet?
Every business cycle has an inflationary and deflationary part, and it's very important for both traders and investors at least to try to have some understanding which has the upper hand at any particular point in time Read More
GoNoGo Charts7mo ago
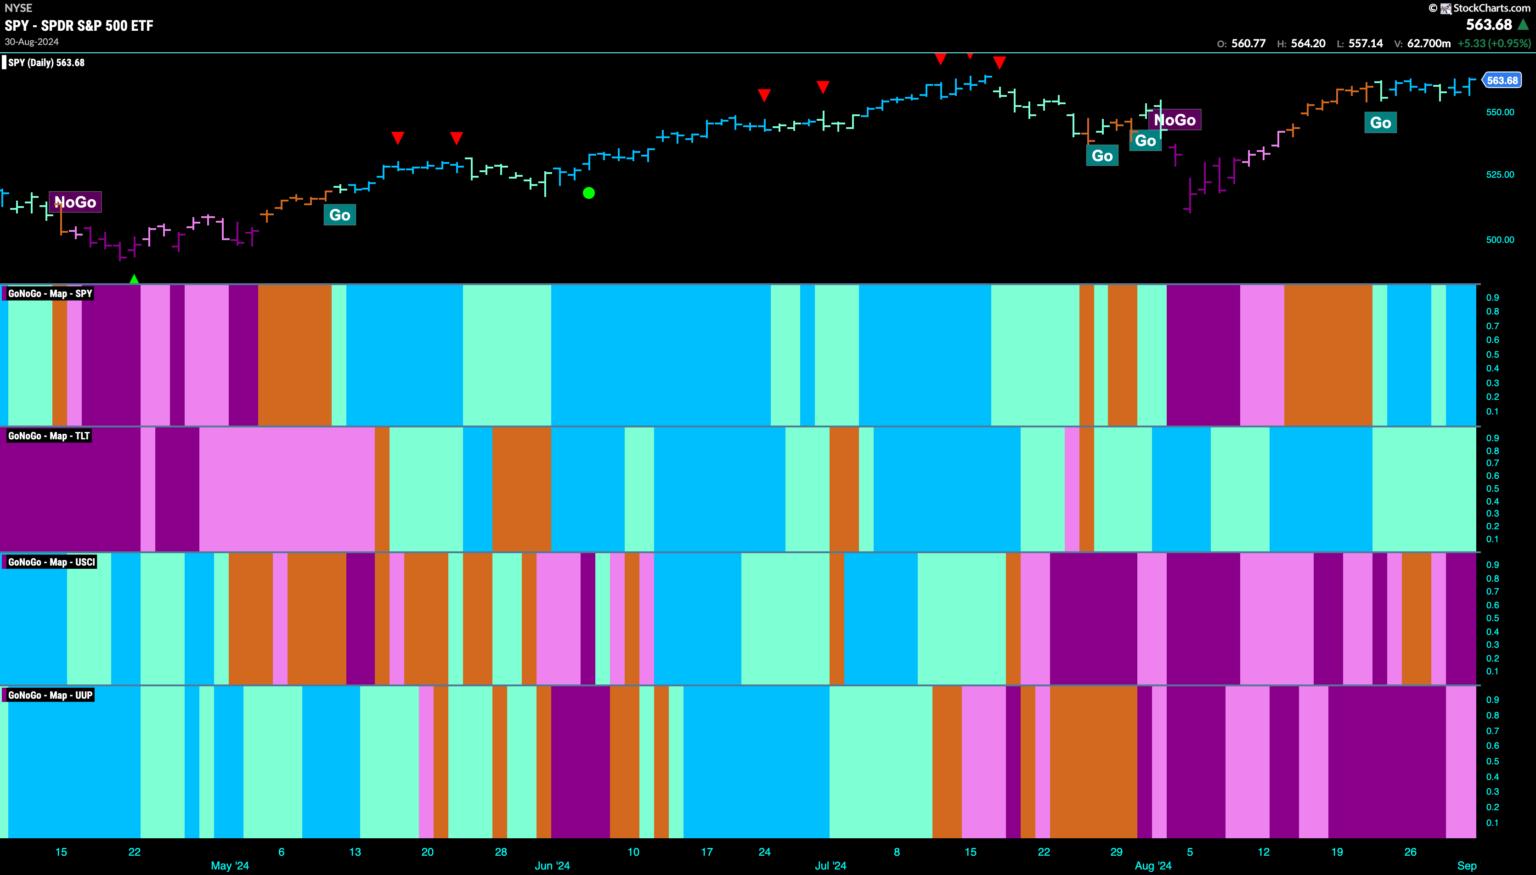
Equities Hold Firm in "Go" Trend as Industrials Play Strong Defense
Good morning and welcome to this week's Flight Path. Equities consolidated their new "Go" trend this week. We see that the indicator painted mostly strong blue bars even as price moved mostly sideways Read More
Dancing with the Trend7mo ago
Signing Off
Signing Off I want to thank the owner/President of StockCharts.com, Chip Anderson, and his son, Eric, for 25 years of friendship, over 10 years of writing 200+ articles in my "Dancing with the Trend" blog on StockCharts.com. StockCharts Read More
Art's Charts7mo ago

It all Started with a Big Bang!
Extended trends often start with big bangs and major breakouts. Chartists can identify "big bang" moves by showing price change in ATR terms. We can use the price charts to identify big breakouts. Today's example will show Paypal (PYPL), which is part the FinTech ETF (FINX) Read More
Trading Places with Tom Bowley7mo ago
Recognize The New Leaders NOW!
We had a sneak preview of emerging leadership on the morning of July 12th. That was the morning the June Core CPI came in well below expectations Read More
Analyzing India7mo ago
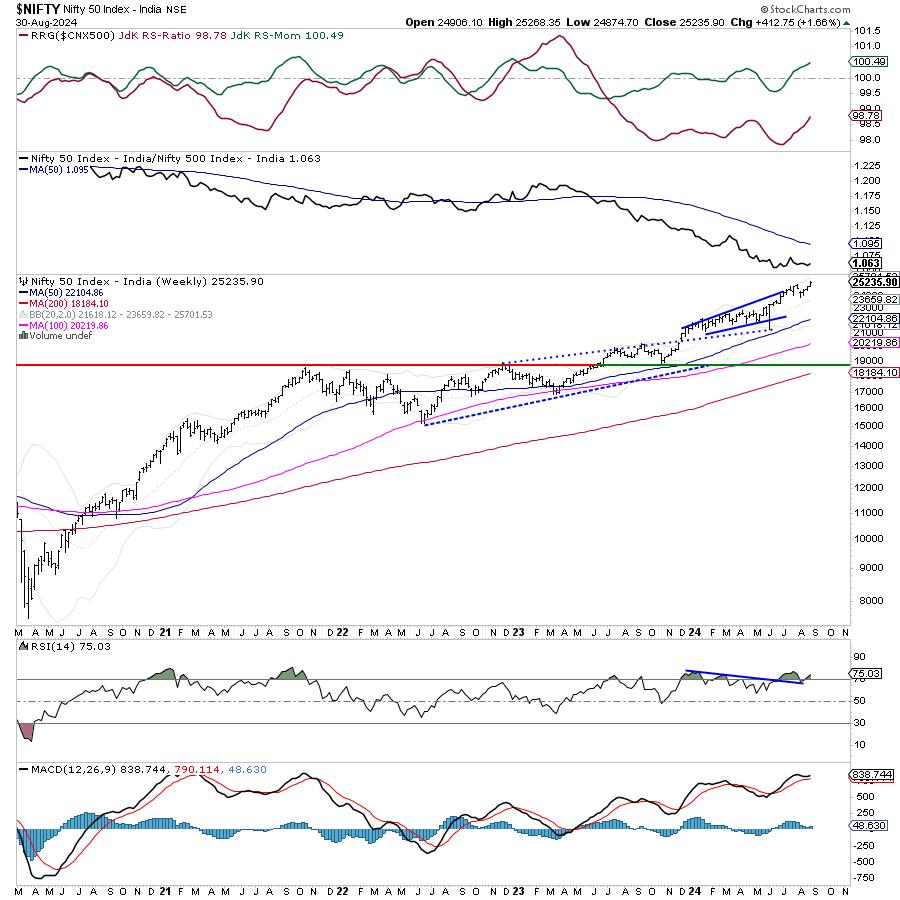
Week Ahead: Uptrend Stays Intact for NIFTY; RRG Shows Distinctly Defensive Setup
The past session for the markets stayed quite trending, as the headline index continued with its upward move. While extending its gains, the Nifty 50 Index ended the week on a very strong note Read More
Popular Articles

This is the Group to Watch for the Next Bull Market Phase and Separating Noise from Reality

When in Doubt, Follow the Leadership

200-Day Moving Average Confirms Bearish Phase

An Oversold Bounce is One Thing - A Bullish Breadth Thrust is Another

Stay Ahead of the Stock Market: Key Bond Market Signals Explained with Charts

Is This the Confidence Trap That Could Wreck Your Retirement Portfolio?
Get expert technical commentary delivered straight to your inbox! Sign up for our FREE weekly ChartWatchers Newsletter. Learn More
Featured Authors


Public ChartList Leaders


StockCharts Members unlock complete access to the Stocks & Commodities Magazine archives. Read the latest articles or browse past editions.