TAKEAWAYS
- Carvana stock fell behind in its ranking during its August–September pullback, but it's now gaining momentum.
- From a weekly perspective, the uptrend in Carvana looks solid.
- Watch the Fibonacci retracement levels on the weekly chart to identify your entry and exit points.
On August 5, we featured Carvana (CVNA), which at the time took the top StockCharts Technical Rank (SCTR) spot for the Large Cap Top 10. The stock has pulled back since then, but is now gaining traction. Perhaps the Fed's decision to cut interest rates by half a percentage point added some fuel to the stock. With lower interest rates, people may be more inclined to get auto loans.
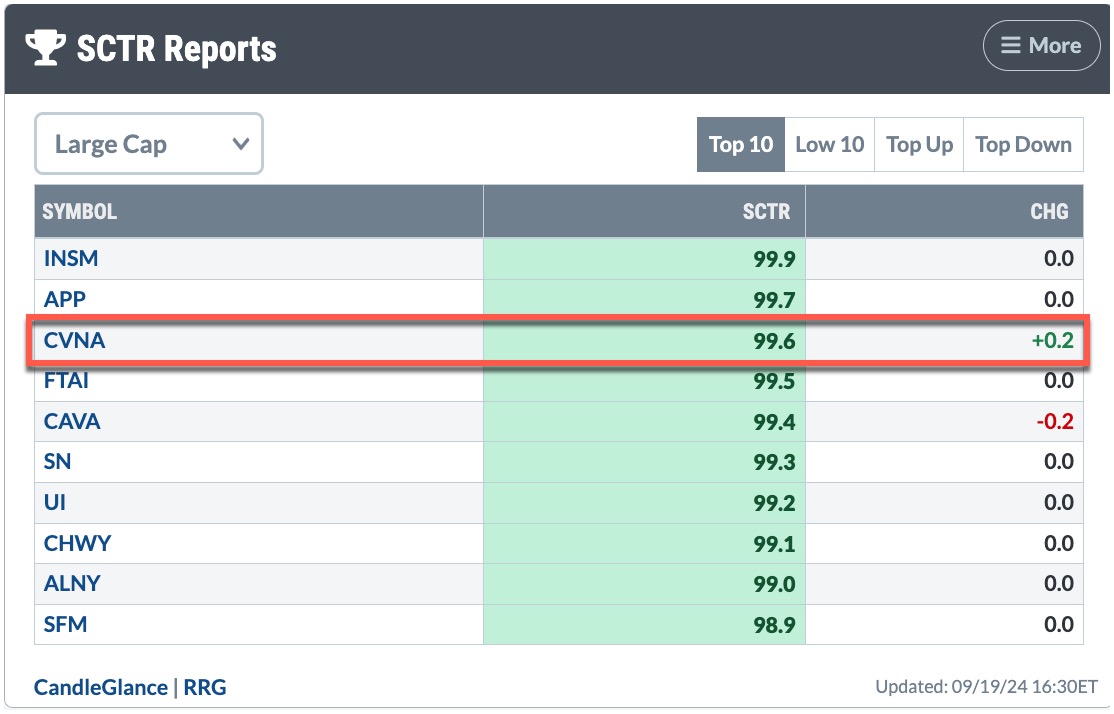
On Thursday, CVNA secured a third-place position in the Large Cap Top 10 SCTR scores. Let's consider where CVNA is now and whether it's worth adding positions to your portfolio.

FIGURE 1. SCTR REPORT FOR SEPTEMBER 19. Carvana is in third place. Will it retake its gold medal position?Image source: StockCharts.com. For educational purposes.
Carvana Stock Analysis
We'll start with an analysis of CVNA's weekly chart (see below).

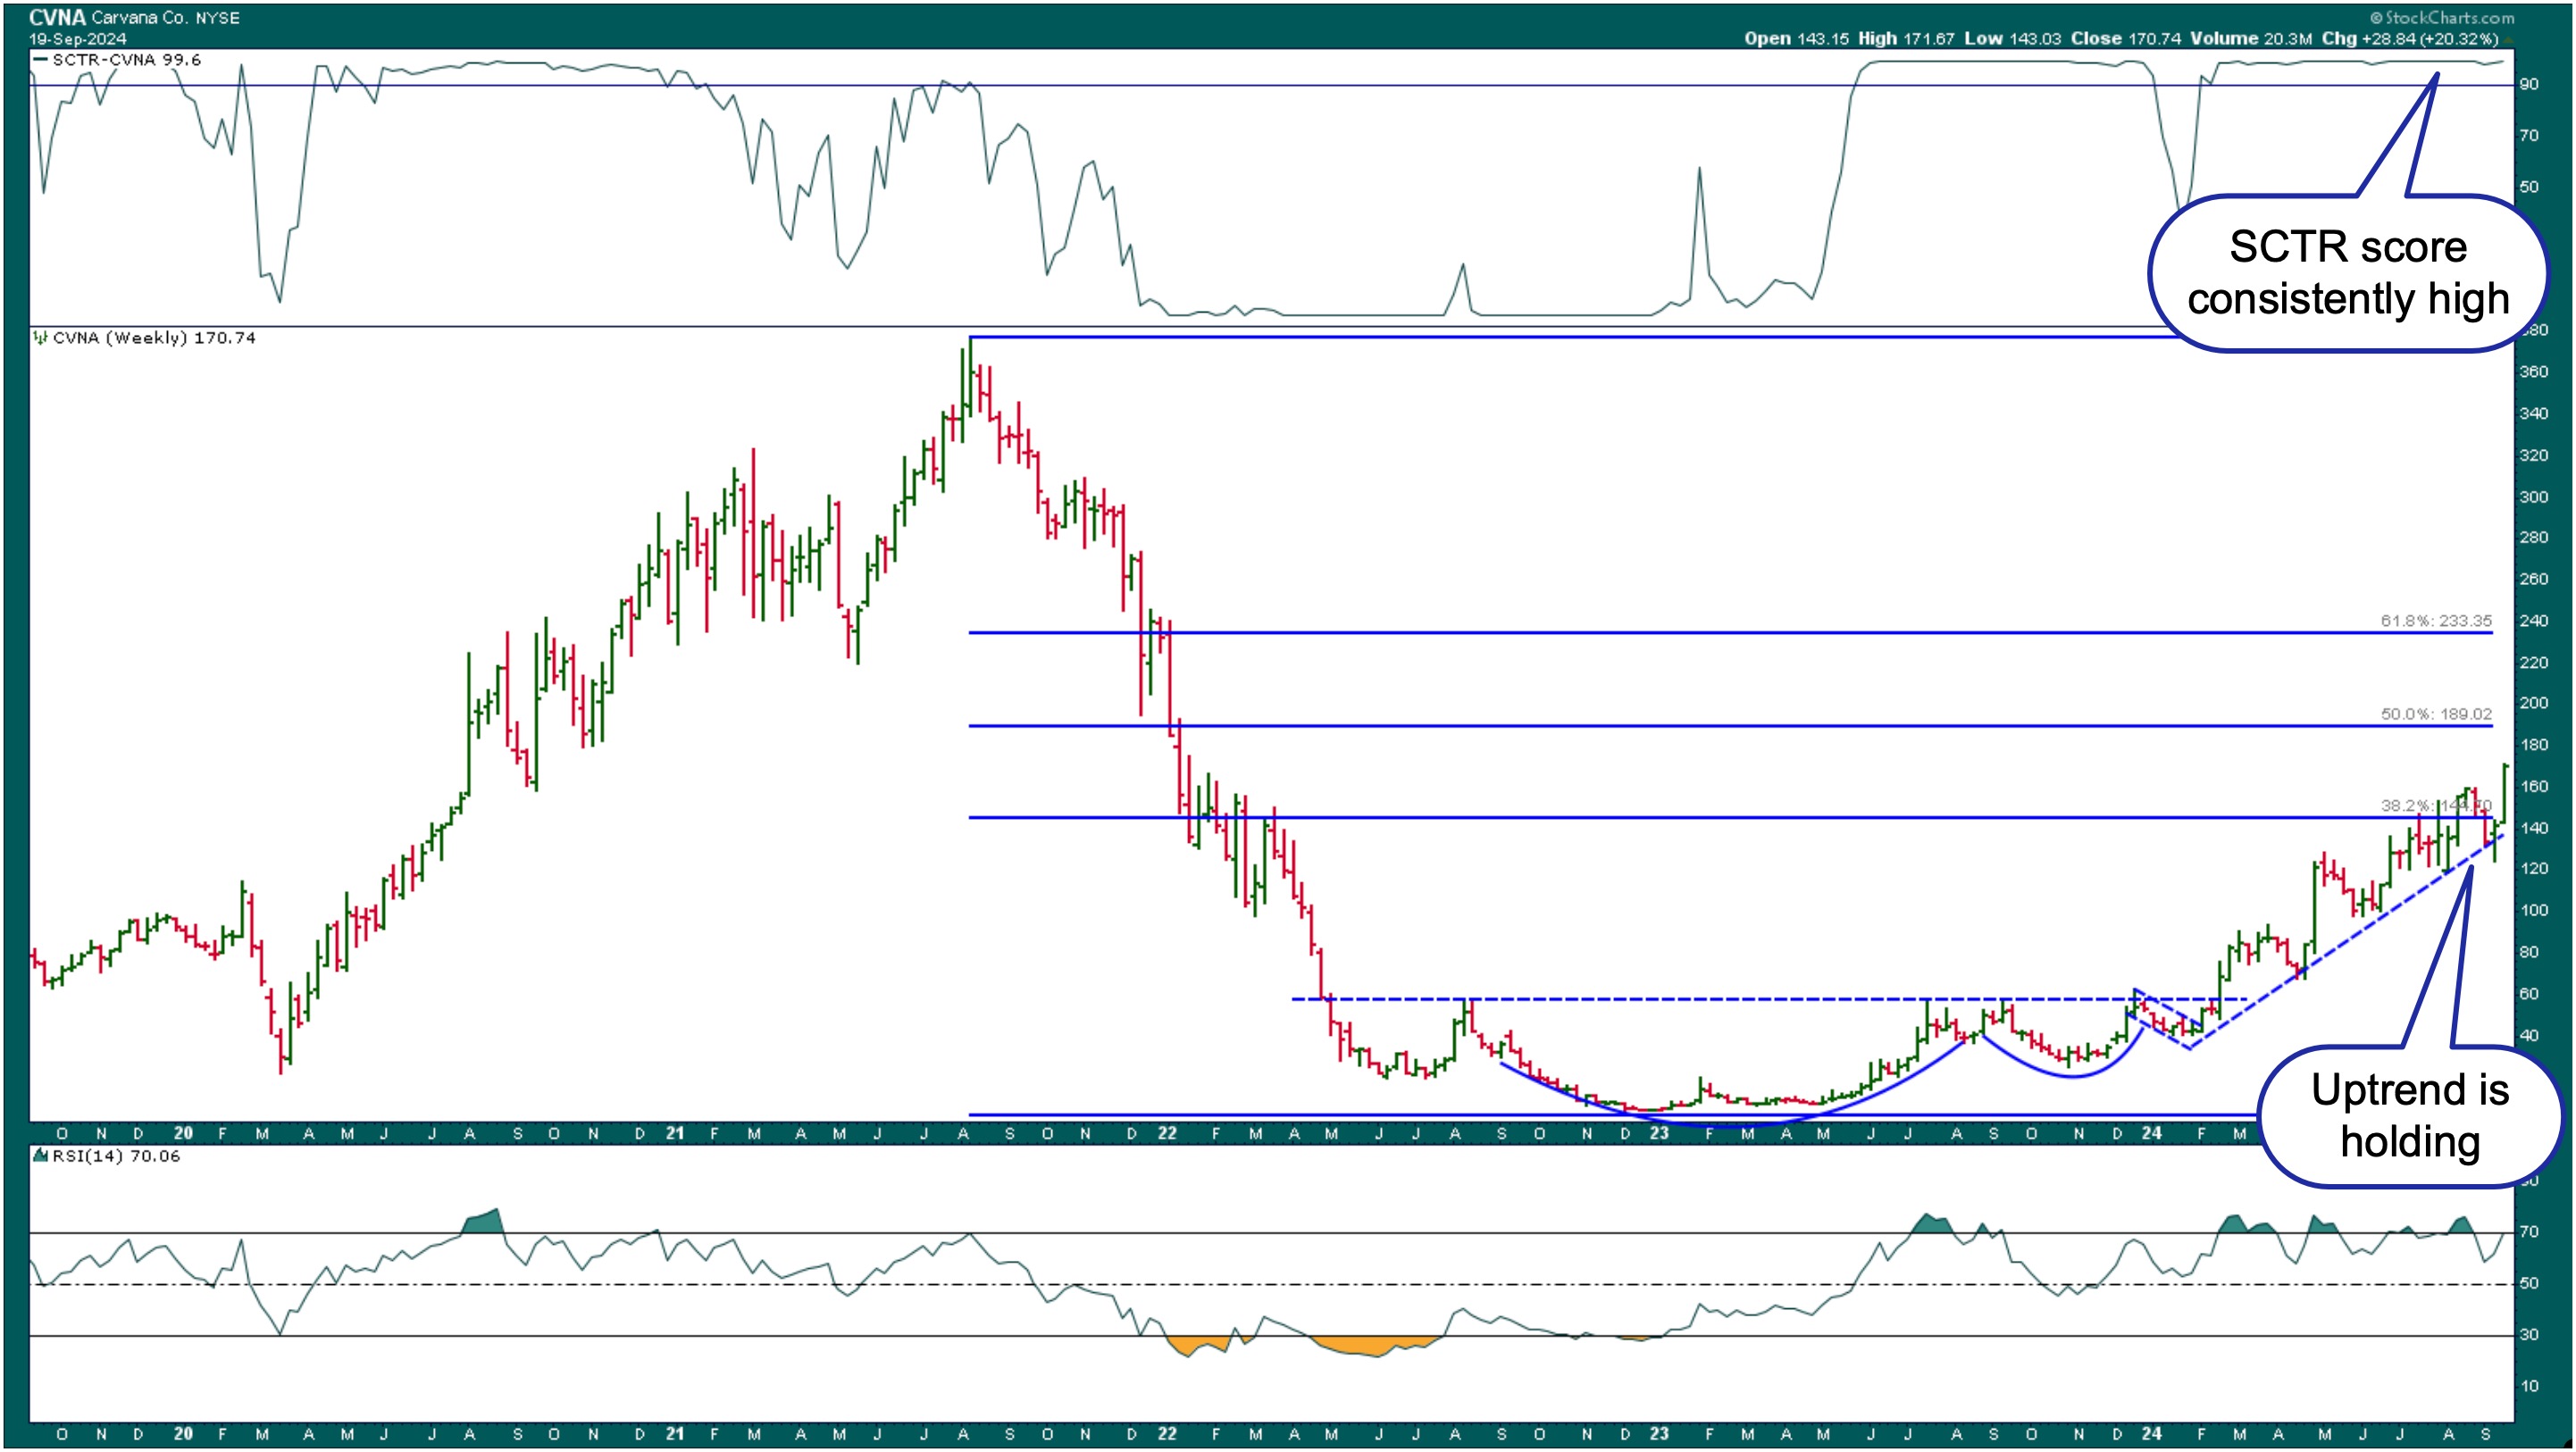
FIGURE 2. WEEKLY CHART OF CARVANA STOCK PRICE. The uptrend is still holding and the SCTR score is just above 99. The RSI is at the 70 level, which means there's room for the stock price to move higher.Chart source: StockCharts.com. For educational purposes.
Carvana's uptrend in the weekly chart is still intact. It's trading above the blue dashed trendline, and, so far, the series of higher highs and higher lows is still holding. The SCTR score is at 99, a level that has sustained since February 2024. The relative strength index (RSI) is just at the 70 level.
Is it worth buying Carvana now? Let's analyze Carvana stock's daily price action (see below).

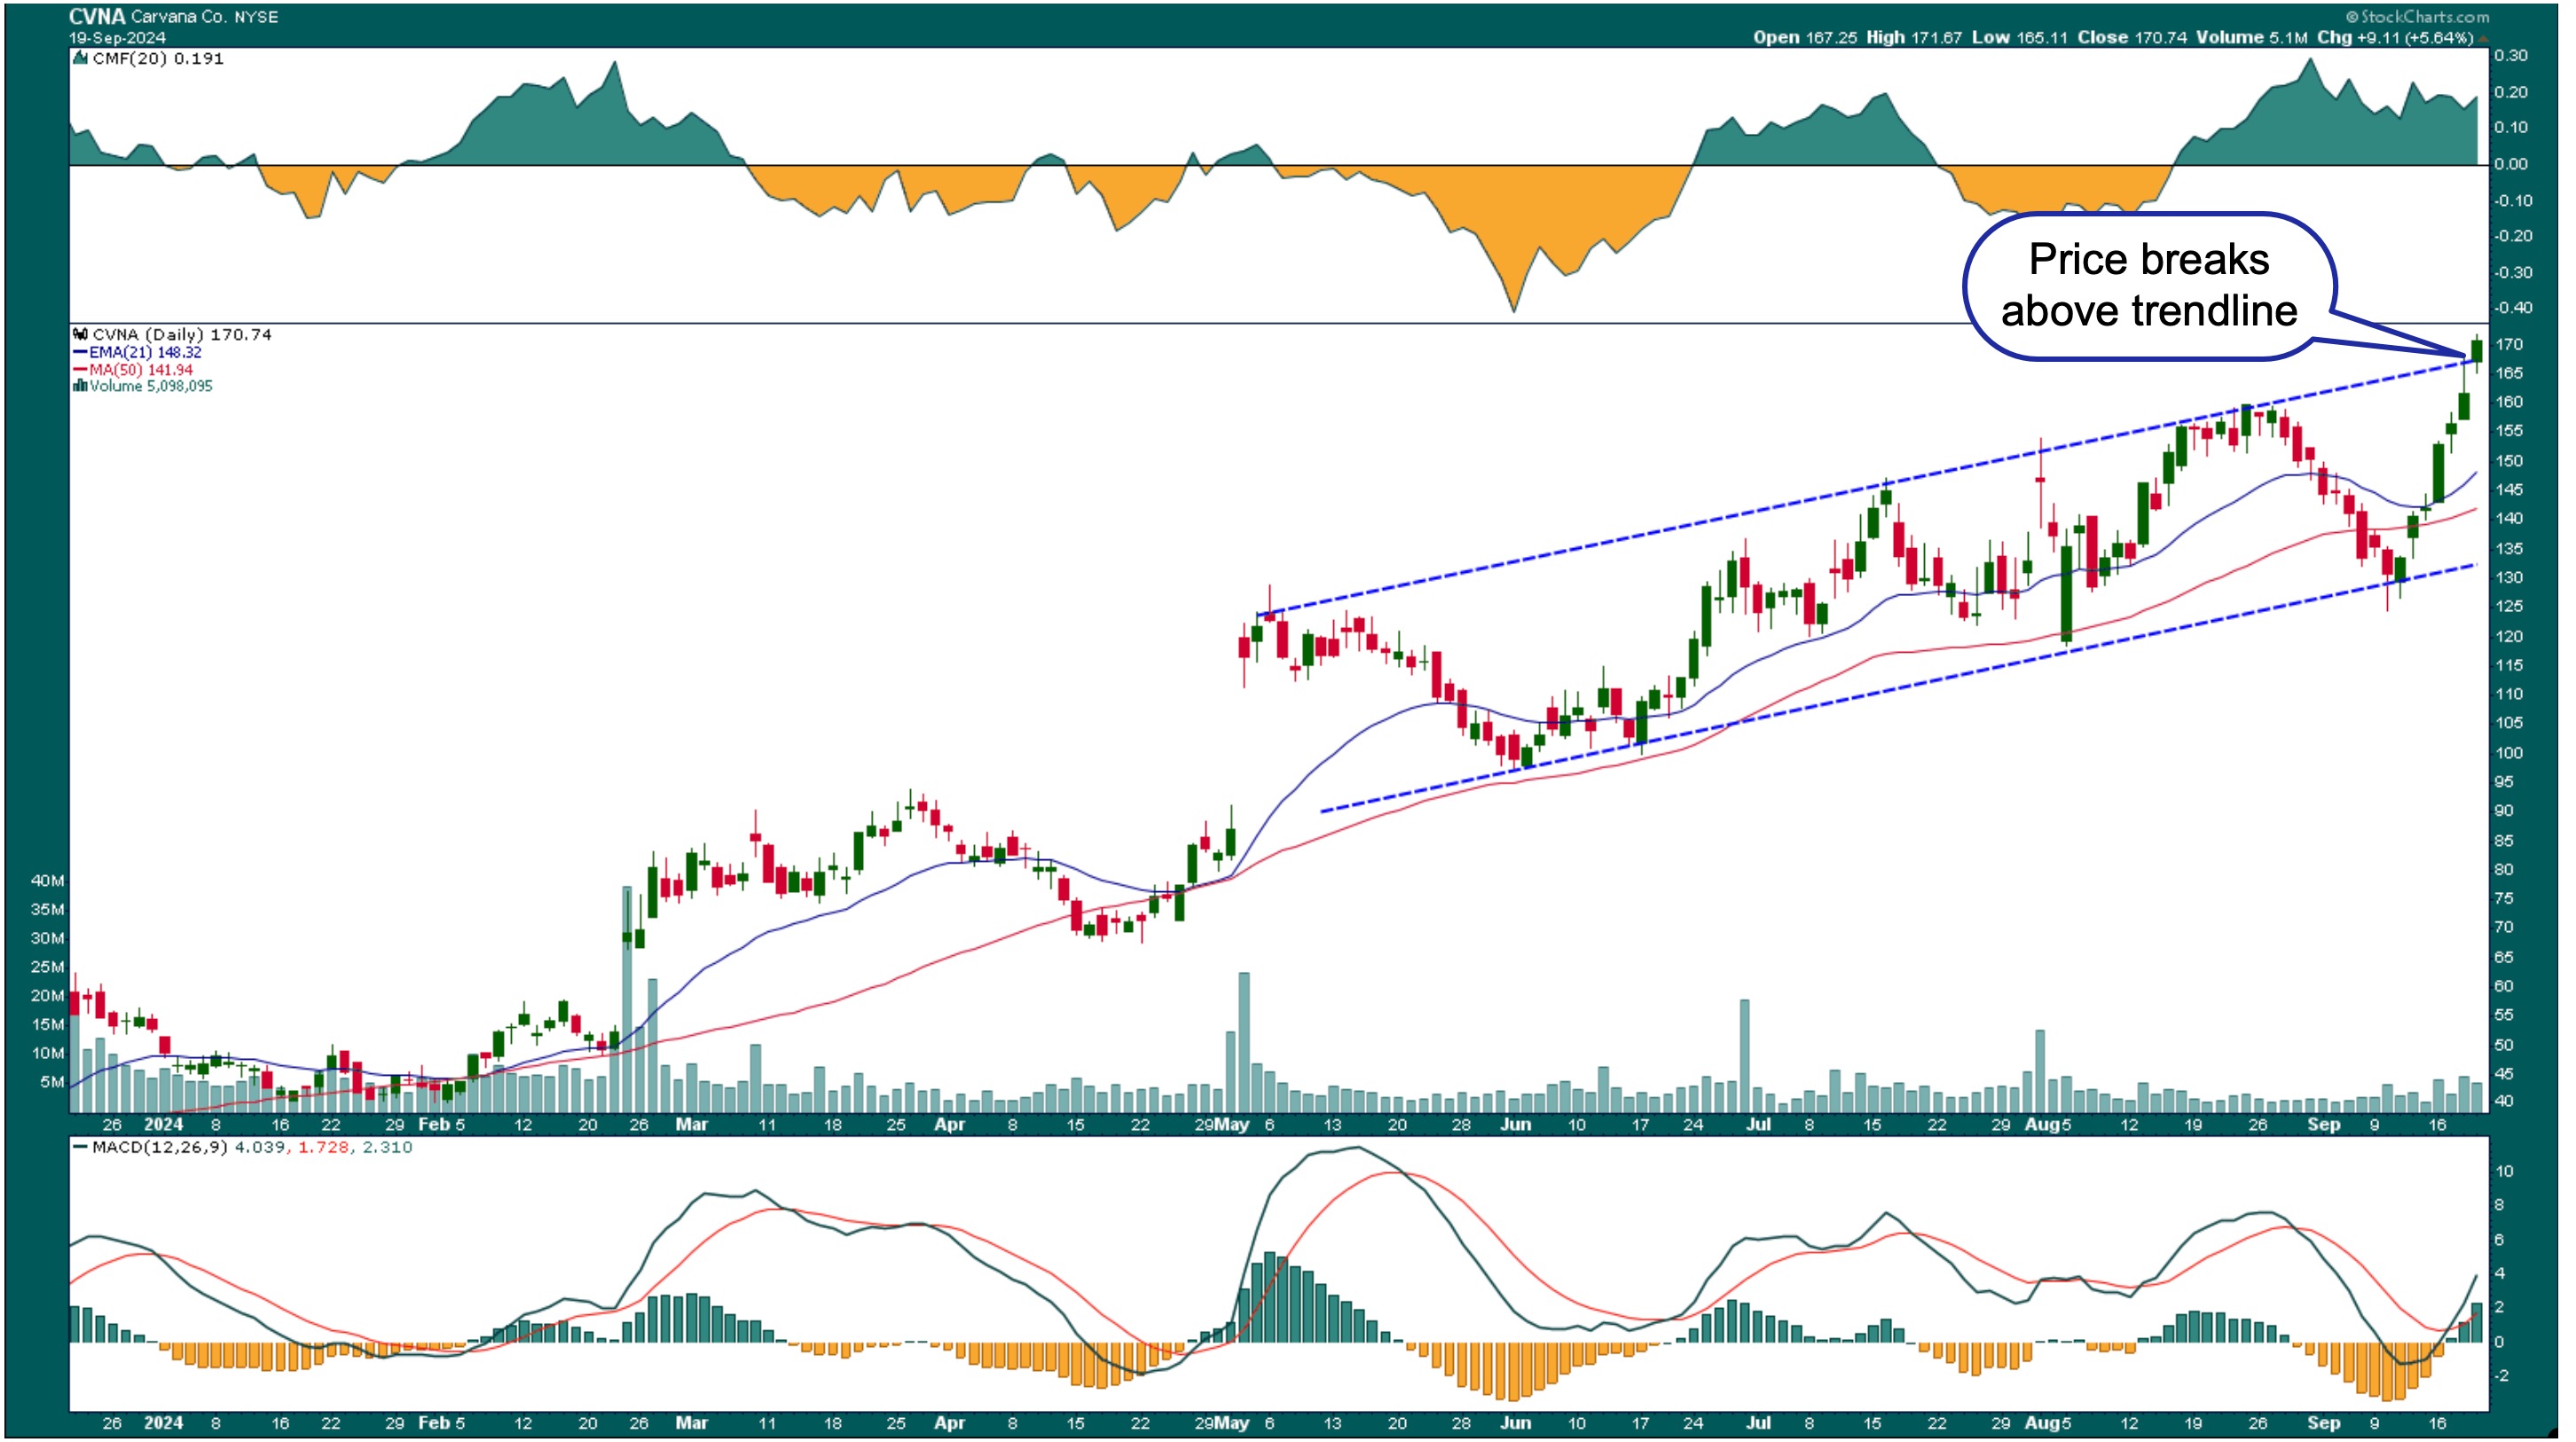
FIGURE 3. DAILY CHART OF CARVANA. A break above the top trendline is a positive move for the stock. If volume increases, buying pressure remains strong, and price momentum supports an up move, Carvana could move much higher.Chart source: StockCharts.com. For educational purposes.
After its August–September pullback, a new trendline had to be created to account for the September low. CVNA stock is still in an uptrend, displaying a series of higher highs and higher lows. The stock price has broken through the upper channel line. You must ensure that momentum is strong to support a follow-through in price.
The weekly chart shows that CVNA's stock price could move up to the next Fibonacci retracement, the 50% level. The Chaikin Money Flow (CMF) indicates that buying pressure is still strong, and the Moving Average Convergence/Divergence (MACD) oscillator shows that momentum is increasing. Both indicators support an upward move in CVNA's stock price. Volume has increased in the last few days, but it needs to remain above average while Carvana's stock price rises.
When Should You Buy Carvana Stock?
The break above the upper channel would be an ideal entry point for a long position. The stock can potentially move to $189, the first Fibonacci retracement level on the weekly chart. If the stock market is bullish and momentum remains strong enough to push the stock price higher, CVNA could move even higher.
When Should You Exit Carvana Stock?
If Carvana breaks below the upper trendline and falls back into the channel with slowing momentum, exit the trade. You may have another opportunity to enter the trade at a later time. If Carvana's stock price continues to rise, place a trailing stop and be prepared to exit at least some of your positions if the stop gets violated.
The bottom line. Add the daily and weekly CVNA charts to your StockCharts ChartLists and continue to monitor them. The weekly chart clearly shows support and resistance levels, which will help to set your profit targets. Set StockCharts Alerts to notify you when specific price levels are hit.

Disclaimer: This blog is for educational purposes only and should not be construed as financial advice. The ideas and strategies should never be used without first assessing your own personal and financial situation, or without consulting a financial professional.
Happy charting!
