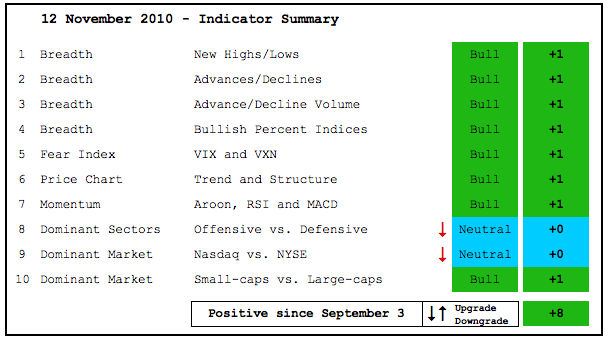
The indicator summary remains firmly positive, but weakness in the technology and industrials sectors caused me to downgrade two of the ten indicators. These downgrades were simply from bullish to neutral. A few days of weakness is not enough to change the overall picture. The market remains in bull mode, but also ripe for a pullback or a consolidation. This week's decline and this could be the start of the corrective period. Keep in mind that the bigger uptrend still holds the trump cards. Also note that yearend performance anxiety could cause under-invested portfolio managers to buy the dips. A corrective period could involve a sideways trading range.
- AD Lines: Bullish. The AD Lines turned down this week, but remain in uptrends overall.
- AD Volume Lines: Bullish. The AD Volume Lines also turned down this week, but remain in uptrends overall.
- Net New Highs: Bullish. Nasdaq and NYSE Net New Highs pulled back sharply from their October highs, but remain in positive territory overall.
- Bullish Percent Indices: Bullish. All Bullish Percent Indices are above 50%.
- VIX/VXN: Bullish. The S&P 500 Volatility Index ($VIX) and the Nasdaq 100 Volatility Index ($VXN) remain in downtrends. Falling and low implied volatility is positive for stocks.
- Trend Structure: Bullish. QQQQ, SPY, DIA and IWM all forged new highs for the current move.
- SPY Momentum: Bullish. MACD(5,35,5) and Aroon (20) moved into positive territory the second week of September and RSI surged above 60.
- Offensive Sector Performance: Neutral. The consumer discretionary sector remains strong, but the industrials sector slipped significantly and the tech sector took a big hit this week. With finance still a bit on the fence, I am moving to neutral on this indicator.
- Nasdaq Performance: Neutral. The $COMPQ:$NYA ratio formed a lower high this week, but has yet to break last week's reaction low.
- Small-cap Performance: Bullish. The $RUT:$OEX ratio surged above its October highs and small-caps continue to show relative strength.
- Breadth Charts have been updated (click here)
This table is designed to offer an objective look at current market conditions. It does not aim to pick tops or bottoms. Instead, it seeks to identify noticeable shifts in buying and selling pressure. With 10 indicator groups, the medium-term evidence is unlikely to change drastically overnight. Previous turns include: Positive on 11-Sept. Negative on 5-February. Positive on 5-March. Negative on 11-June. Positive on 18-June. Negative on 24-June. Positive on August 6. Negative on August 13. Positive on September 3.

