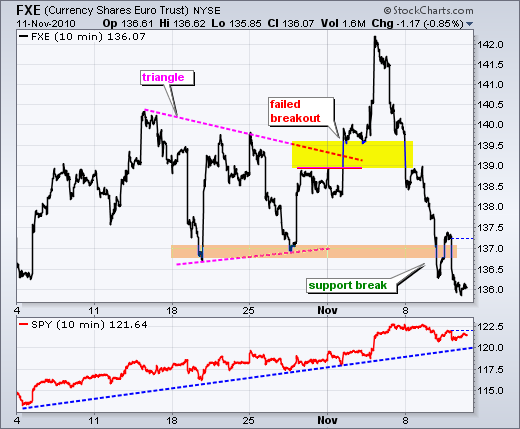
After breaking triangle resistance at the beginning of November, the Euro Currency Trust (FXE) gave it all back and broke support from the late October lows. This reversal of fortune is quite amazing. Since the surge above 142 late last week, FXE has fallen over 4% in six trading days. This is a big move for a currency and suggests that a medium-term trend reversal is afoot. Stocks and the Euro have been positively correlated throughout 2010 as both rose and fell together for the most part. However, stocks are holding up pretty well considering the sharpness of the Euro decline. In any case, we should watch stocks close because there could be a delayed reaction.
There is no change on the daily or the 30-minute charts. SPY remains in an uptrend on the daily chart with a rising price channel over the last eight weeks. After surging above 122 last Thursday and then stalling for two days, the ETF formed a bearish engulfing pattern on Tuesday. However, there was no follow through as the ETF recouped early losses on Wednesday and closed strong. The bulls remain resilient. I am moving short-term support to 119.90 (~120). A move below this level would break channel support and call for a consolidation or a pullback. The first break will probably not result in an extended decline. More likely, the first dip will entice buyers and some sort of trading range will form.

The 60-minute chart confirms support around 120 from the rising channel Also notice that the gap zone marks support around 120-121. RSI bounced off 40 for at least the third time since early October. The combination of a break below 119.90 and an RSI break below 40 would e enough to reverse the short-term uptrend.

Key Economic Reports:
Nov 12 - 09:55 - Michigan Sentiment
Charts: Tuesday and Thursday in separate post.
-----------------------------------------------------------------------------
This commentary and charts-of-interest are designed to stimulate thinking. This analysis is not a recommendation to buy, sell, hold or sell short any security (stock ETF or otherwise). We all need to think for ourselves when it comes to trading our own accounts. First, it is the only way to really learn. Second, we are the only ones responsible for our decisions. Think of these charts as food for further analysis. Before making a trade, it is important to have a plan. Plan the trade and trade the plan. Among other things, this includes setting a trigger level, a target area and a stop-loss level. It is also important to plan for three possible price movements: advance, decline or sideways. Have a plan for all three scenarios BEFORE making the trade. Consider possible holding times. And finally, look at overall market conditions and sector/industry performance.

