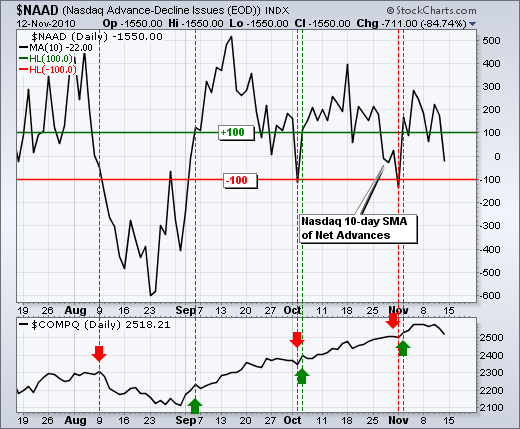
Breadth took a hit last week, but my short-term breadth indicators have yet to turn bearish. The next four charts show the 10-day SMA for Net Advances and Net Advancing Volume for the Nasdaq and NYSE. These indicators oscillate above/below the zero line. However, I add a buffer by setting the bull line (green) set at +100 and the bear line (red) at -100. Moves above and below these levels signal a short-term shift in breath. All four indicators fell below the +100 level last week. The 10-day SMA for Nasdaq Net Advances was the weakest as it fell below zero. All four remain above -100 though and have yet to trigger bearish signals. I like to use these indicators in pairs. For example, signals should be validated by each other. Nasdaq breadth is considered bearish when BOTH Nasdaq indicators move below -100. A split decision results when one only one has yet to cross. Moreover, a signal remains in force until cancelled out with an opposite signal. This means the current bull signals will not be cancelled out (reversed) until these indicator pairs move below -100. The other three charts can be seen after the jump.


This commentary and charts-of-interest are designed to stimulate thinking. This analysis is not a recommendation to buy, sell, hold or sell short any security (stock ETF or otherwise). We all need to think for ourselves when it comes to trading our own accounts. First, it is the only way to really learn. Second, we are the only ones responsible for our decisions. Think of these charts as food for further analysis. Before making a trade, it is important to have a plan. Plan the trade and trade the plan. Among other things, this includes setting a trigger level, a target area and a stop-loss level. It is also important to plan for three possible price movements: advance, decline or sideways. Have a plan for all three scenarios BEFORE making the trade. Consider possible holding times. And finally, look at overall market conditions and sector/industry performance.
