Art's Charts February 26, 2010 at 06:19 AM
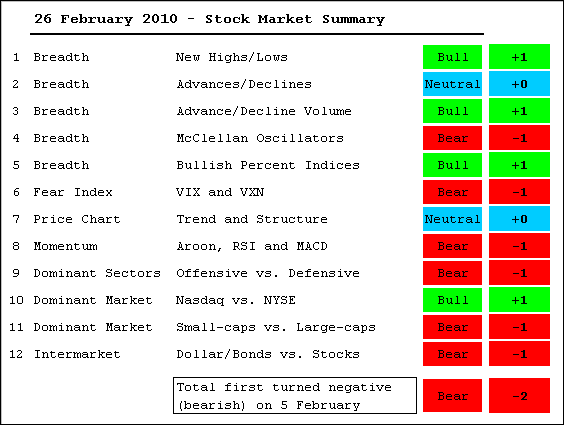
It remains a tricky period for the stock market. Overall, the market summary table comes in at -2, which is slightly bearish. There are, however, a few indicators that could go either way... Read More
Art's Charts February 26, 2010 at 03:58 AM
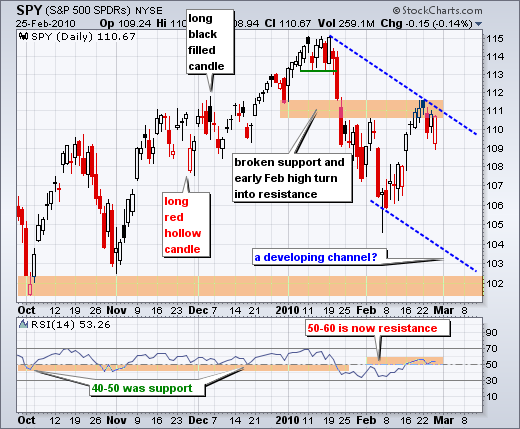
Before looking at the falling flag on the 60-minute chart, let's review some candlestick action on the daily chart. There is no change in the overall analysis as SPY appears to be developing a falling price channel. A break above 111.10 would throw cold water on this theory... Read More
Art's Charts February 25, 2010 at 05:07 AM
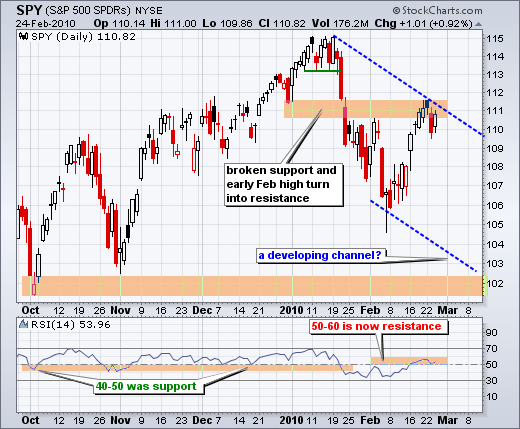
There is not much change on the daily chart. SPY hit resistance in the 111 area over the last few days. This resistance zone stems from broken support and the early February high. It also marks a 62% retracement of the January-February decline... Read More
Art's Charts February 24, 2010 at 04:05 AM
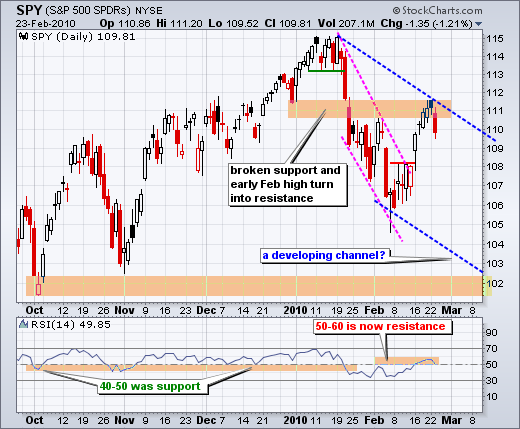
After yakking about SPY resistance in the 111 area and RSI resistance in the 50-60 area for at least a week, it finally came to pass. With a broad decline on Tuesday, SPY backed off the potential resistance zone to turn it into a confirmed resistance zone... Read More
Art's Charts February 23, 2010 at 03:46 AM
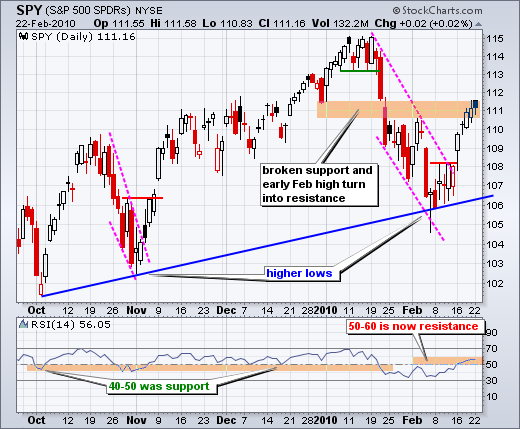
Even though the advance slowed over the last few days, the S&P 500 ETF (SPY) continues to hold its gains as buying pressure exceeds selling pressure. On the daily chart, SPY is up around 5% in the last two weeks and trading in a potential resistance zone around 111... Read More
Art's Charts February 22, 2010 at 06:32 AM
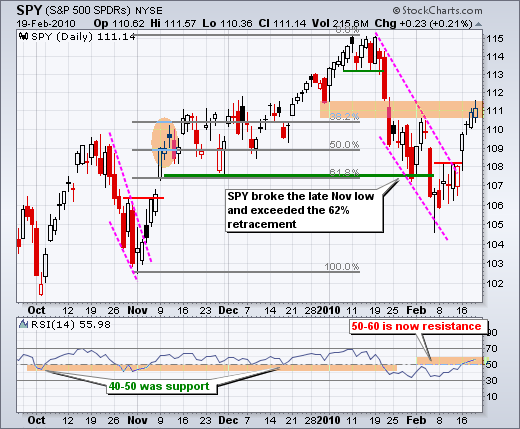
When marking support, resistance and reversal levels, zones are preferred to exact levels for two reasons. First, indices and ETFs are based on a basket of stocks. With more than one stock influencing price, we cannot expect support, resistance or reversal levels to be EXACT... Read More
Art's Charts February 19, 2010 at 06:22 AM
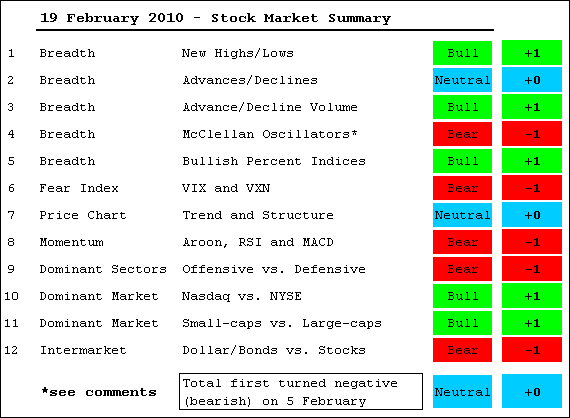
Transition periods are tricky. The bulk of the evidence shifted towards the bears on February 5th, but the Market Summary Table shifted to +2 this week, which slightly favors the bulls. Three items are responsible for this shift. The McClellan Oscillators both moved above +50... Read More
Art's Charts February 19, 2010 at 04:19 AM
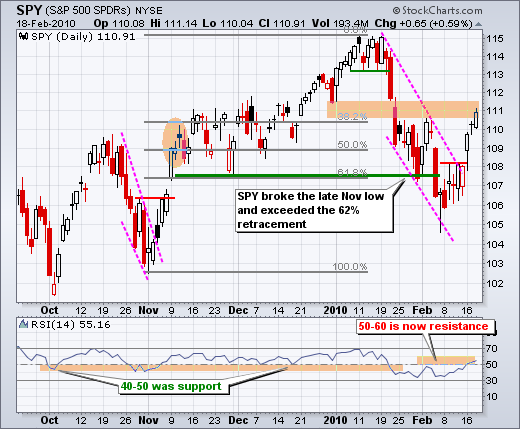
Even though SPY closed at its highest close of the month, I still think the ETF is in a resistance zone and this oversold bounce is getting long on tooth. In short, yesterday's advance does not change my overall view... Read More
Art's Charts February 18, 2010 at 05:14 AM
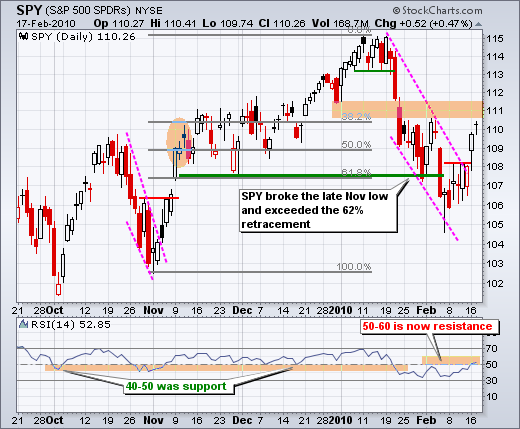
The bounce over the last seven days does not look that strong and resistance is nigh. First, I pointed out mixed breadth and weak volume on Wednesday. Second, individual days show more indecision than strength... Read More
Art's Charts February 17, 2010 at 04:48 AM
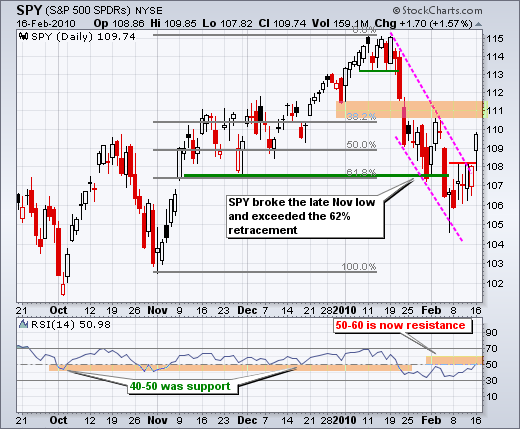
Stocks started strong with a gap up on the open and finished strong with a close near their highs for the day. Overall volume was not that strong and Net Advancing Volume was mixed... Read More
Art's Charts February 15, 2010 at 04:55 AM
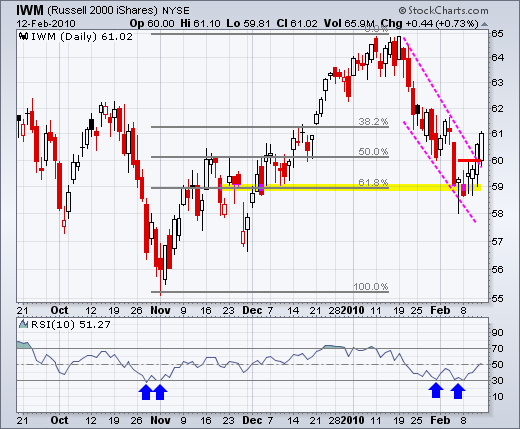
Today I am starting with the Russell 2000 ETF (IWM) and Nasdaq 100 ETF (QQQQ) because both are showing resilience with pretty good advances over the last two days. Both broke above wedge trendlines and finished near the high for the week... Read More
Art's Charts February 12, 2010 at 06:48 AM
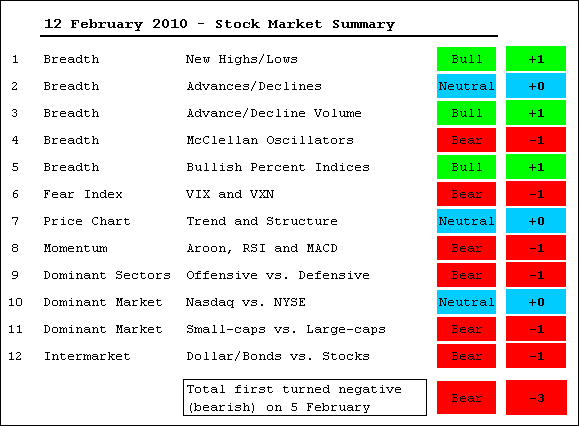
On balance, the evidence still favors the bears at this stage. We are, however, still in a transition period or the early stages. The evidence favored the bulls from early September to February 5th... Read More
Art's Charts February 12, 2010 at 04:59 AM
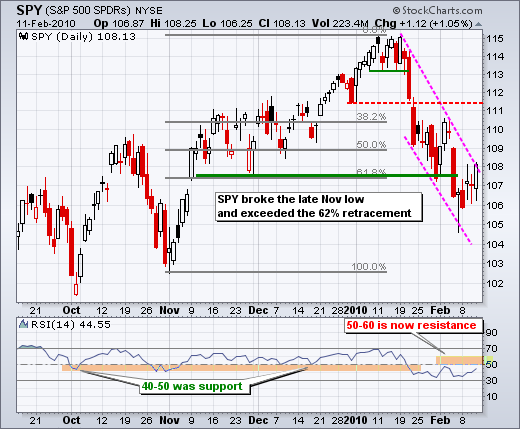
These daily SPY updates are short-term in nature and subject to change as new price data and information come to light - which is hourly. The objective of this analysis is education. It is not meant as a recommendation to buy, sell or sell short... Read More
Art's Charts February 11, 2010 at 04:42 AM
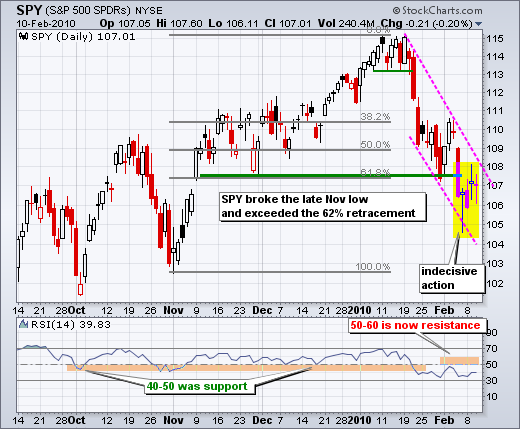
Today I am going to show four daily charts: SPY, RSP, IWM and QQQQ. This is an interesting quartet. SPY broke the late November low and exceeded the 62% retracement... Read More
Art's Charts February 10, 2010 at 04:24 AM
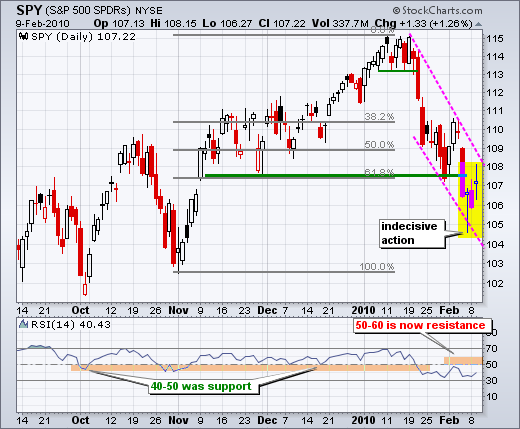
The medium-term and short-term trends are both considered down at this point. SPY broke below its late November support zone with the biggest decline since early last year. After a selling climax of sorts on Friday, the ETF bounced back above 107 on Tuesday... Read More
Art's Charts February 09, 2010 at 04:28 AM
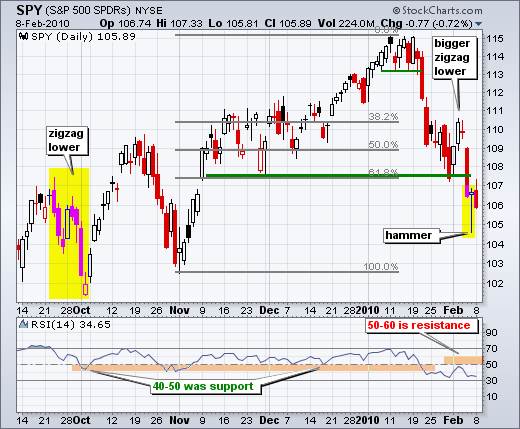
SPY started the day strong, but finished weak and closed with a modest loss. Even though there was no follow through on Monday, the ETF remains short-term oversold and ripe for a bounce or consolidation... Read More
Art's Charts February 08, 2010 at 05:52 AM
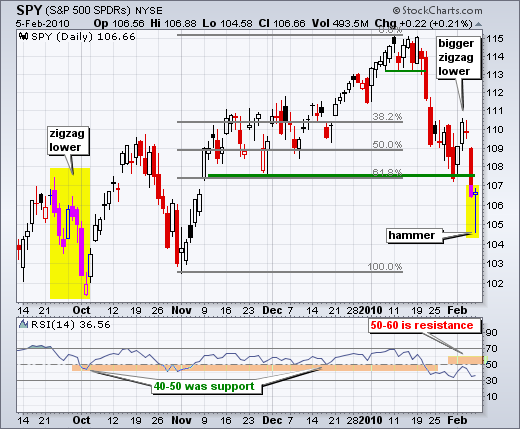
SPY plunged below its late November low on Thursday and firmed on Friday with a reversal candlestick. Even though it is not a picture perfect hammer, the essence of the pattern is clearly there. SPY opened at 106.56, plunged below 105 intraday and recovered to close at 106.66, ... Read More
Art's Charts February 05, 2010 at 05:15 AM
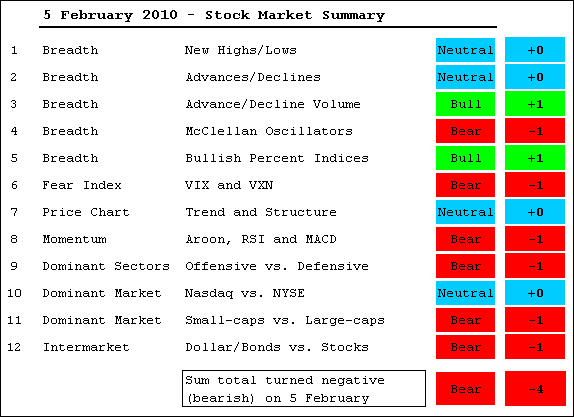
I started this evidence table in September and the bulk of the evidence was net positive from September to January. Signs of weakness started appearing in the second half of January and the evidence turned net negative this week... Read More
Art's Charts February 05, 2010 at 04:01 AM
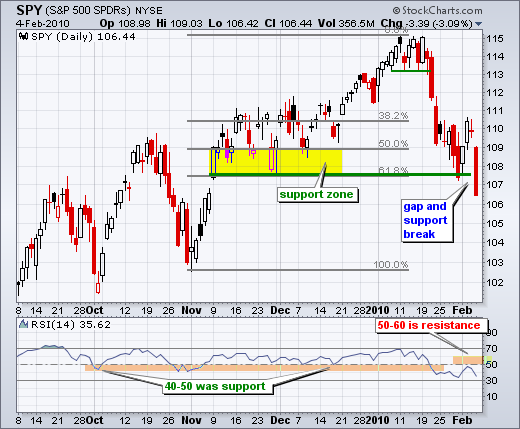
The S&P 500 ETF (SPY) failed at short-term resistance and broke medium-term support with a sharp decline on Thursday. A support zone around 108 held up for the prior six days, but wilted with a long red candlestick yesterday... Read More
Art's Charts February 04, 2010 at 03:46 AM
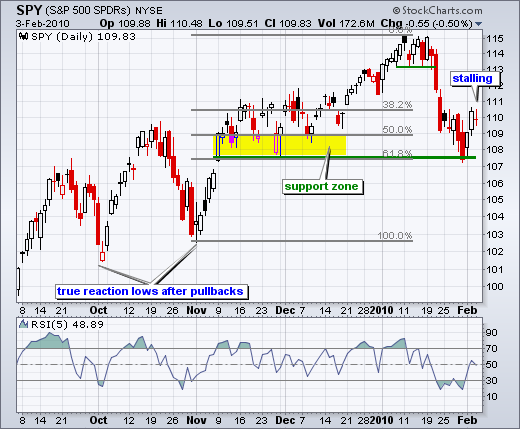
SPY surged off support with two good gains on Monday-Tuesday, but ran into short-term resistance on Wednesday and stalled with a doji. The doji looks like a big plus sign (+). With little change from open to close, the horizontal portion is small or just a line... Read More
Art's Charts February 03, 2010 at 05:29 AM
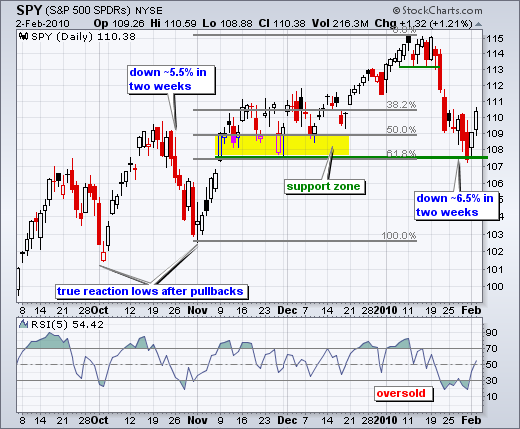
SPY hit the 62% retracement last week and bounced with two good moves this week. At this point, I still consider the medium-term trend up on the daily chart. SPY forged a higher high in early January and held support so far in February... Read More
Art's Charts February 02, 2010 at 04:11 AM
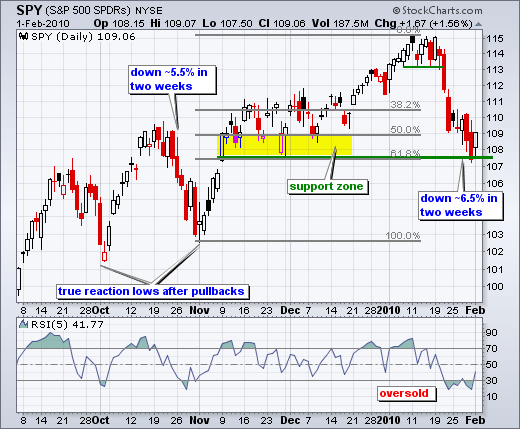
SPY took its decline to the brink of a support break, but manage to firm with a good bounce on Monday. This is enough to stave off a medium-term support break and keep the medium-term uptrend alive. The reasons for support around 108-109 remain unchanged... Read More
Art's Charts February 01, 2010 at 06:17 AM
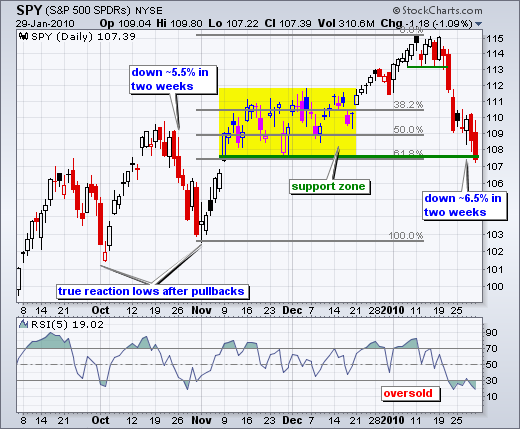
SPY opened strong and closed weak for the second time in two days. Another long red candlestick formed as the ETF closed below its late November low... Read More