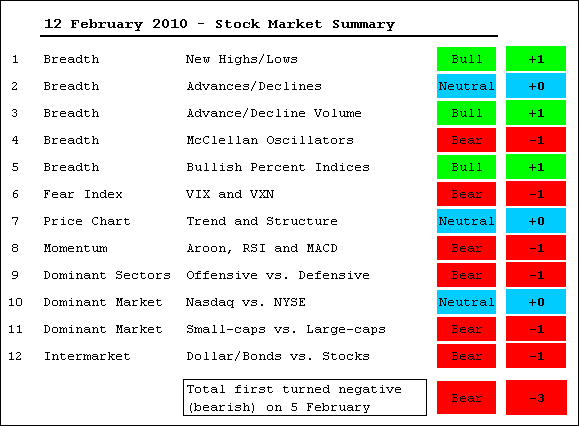
On balance, the evidence still favors the bears at this stage. We are, however, still in a transition period or the early stages. The evidence favored the bulls from early September to February 5th. On February 5th, the sum total turned negative to favor the bears for the first time in five months. This also occurred in early July, but the market ended up making a bottom and moving sharply higher. I was not keeping the table at that time, but I am pretty sure the evidence would have favored the bulls by late July. Because the evidence is still mildly bearish (-2), it is still possible to flip back to the bulls. We saw this with Net New Highs this week as they flipped from negative to positive, albeit barely positive. It would not take much to flip them negative again. At this point, I will simply adhere to the table for a market bias. Keep in mind that this table will not predict a top or bottom. Instead, it is designed to identify and follow until proven otherwise. It is not infallible and it is subject to whipsaw, just like any other set of indicators.


- AD Lines: Neutral. The Nasdaq AD Line is trending down with a lower low in January-February. The NYSE AD Line remains in an uptrend overall.
- AD Volume Lines: Bullish. The Nasdaq AD Volume Line is still in an uptrend and the NYSE AD Line is still in an uptrend.
- Net New Highs: Bullish. Nasdaq Net New Highs flipped from negative (-33) to positive (+37). NYSE Net New Highs flipped from negative (-6) to positive (+46).
- McClellan Oscillators: Bearish. The Nasdaq and NYSE McClellan Oscillators plunged below -50 in January and have yet to surge above +50.
- Bullish Percent Indices: Bullish. Although a lagging/coincident indicator, all major index BPI's are above 50%. 8 of 9 sector BPI's are above 50% (XLE is at 43.18%).
- Fear Index: Bearish. The VIX and VXN broke their late November highs to start uptrends in fear.
- Trend Structure: Neutral. SPY and DIA broke their late November lows, but QQQQ, IWM and RSP held corresponding lows and their 62% retracements.
- SPY Momentum: Bearish. The Aroon Oscillator broke -50, MACD (5,35,5) turned negative and 14-day RSI broke its uptrend support zone (40-50).
- Offensive Sector Performance: Bearish. XLF and XLK led the market lower in January-February.
- Nasdaq Performance: Neutral. NY Composite has lagged the Nasdaq since early December.
- Small-caps Performance: Bearish. Small-caps have lagged large-caps since September
- Intermarket: Bearish. Dollar is rising as investors turn risk averse

About the author:
Arthur Hill, CMT, is the Chief Technical Strategist at TrendInvestorPro.com. Focusing predominantly on US equities and ETFs, his systematic approach of identifying trend, finding signals within the trend, and setting key price levels has made him an esteemed market technician. Arthur has written articles for numerous financial publications including Barrons and Stocks & Commodities Magazine. In addition to his Chartered Market Technician (CMT) designation, he holds an MBA from the Cass Business School at City University in London.
Learn More