Market Recap for Friday, May 24, 2019
Before I summarize Friday's numbers, let me first say that the S&P 500 closed near a two-month low while the Volatility Index ($VIX) has been falling as well. I find this to be a very bullish development as nervousness is exiting even though the headlines continue to chirp about US-China trade:
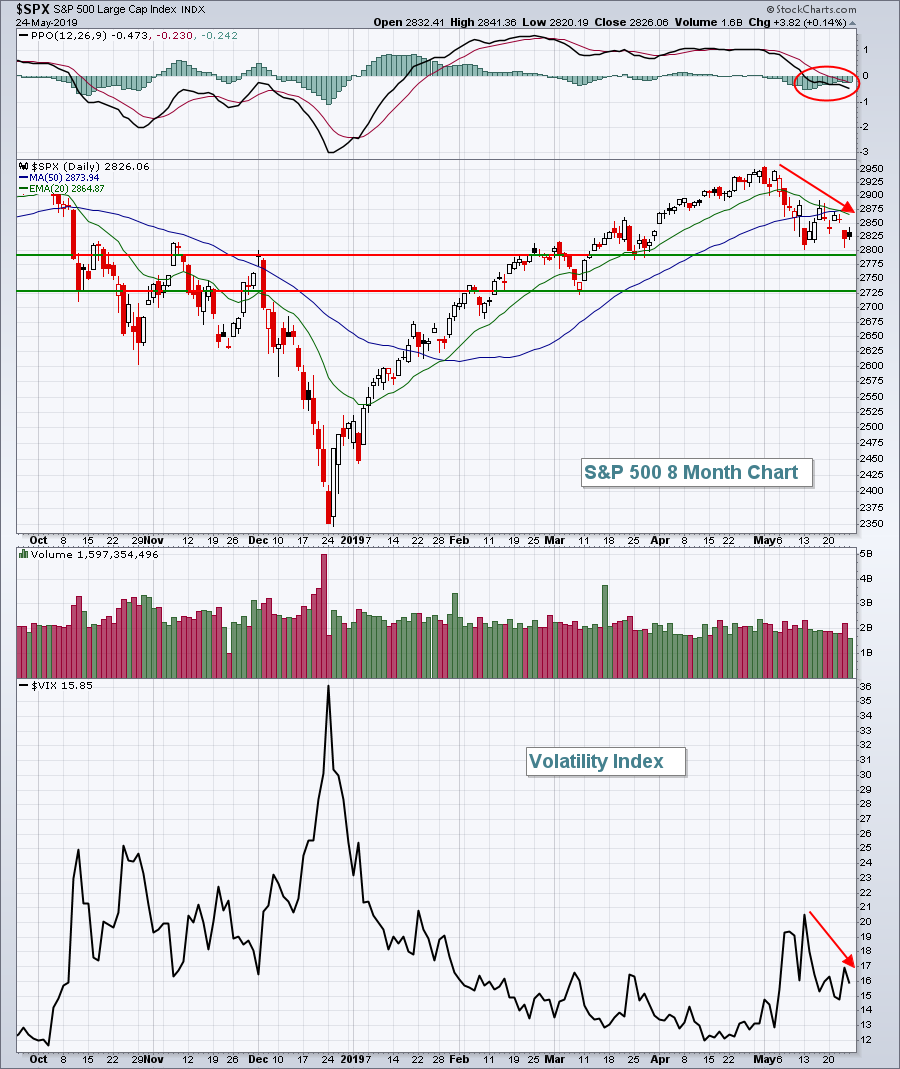 The drop in the S&P 500 with a PPO now in negative territory would seem to be bearish on the surface - and perhaps it'll turn out to be just that. However, the falling VIX tells me a completely different story. Less nervousness almost always translates into higher equity prices. This afternoon, I'll be conducting a webinar with John Hopkins, President of EarningsBeats.com to discuss the relationship of the VIX to the direction of equity prices and show how you can use the subtle sentiment messages that we receive from the VIX to your advantage. It's a FREE webinar that begins today at 4:30pm EST, just after the market closes. To register and for more details, CLICK HERE.
The longer-term S&P 500 chart is actually quite bullish so don't ignore this:
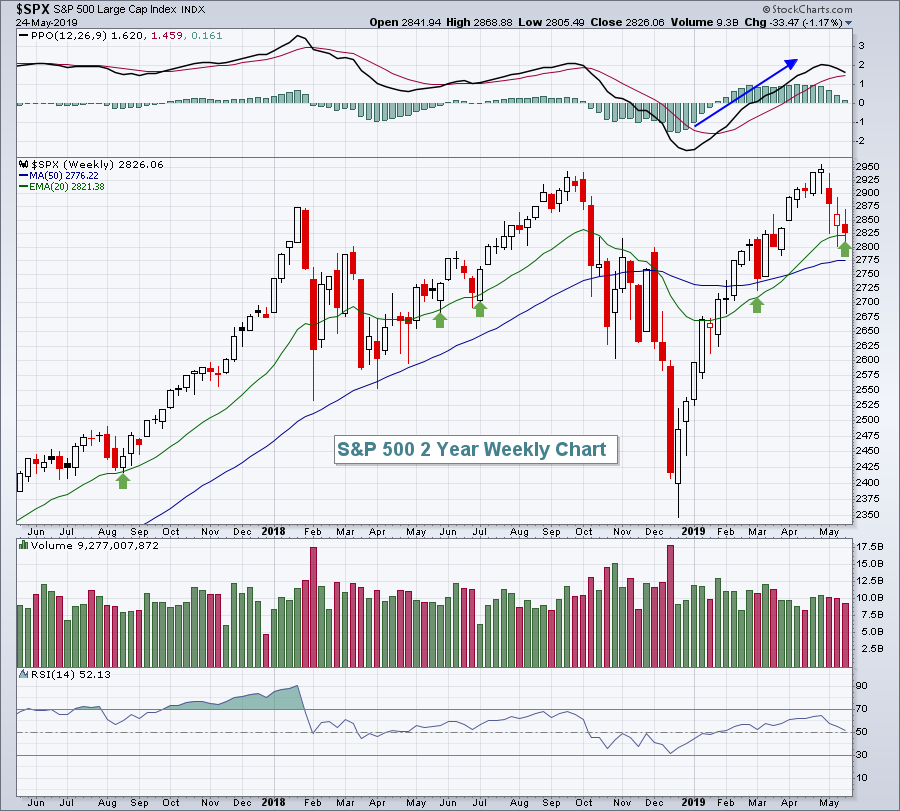 When an index is rising with strong momentum (higher weekly PPO at most recent price high), pullbacks are normally contained at the rising 20 week EMA. It's also worth noting that the next 10 days are extremely bullish historically. I'm looking for a bounce from here.
On Friday, financials (XLF, +0.79%) and materials (XLB, +0.56%) led a mostly quiet session. Consumer staples (XLP, -0.36%) were the laggard, while all other sectors hovered close to breakeven.
Pre-Market Action
The 10 year treasury yield ($TNX) continues its decline, this morning falling another 4 basis points to 2.29%. Worth mentioning is the fact that the shorter-term 3 month treasury note ($UST3M) broke down last week below important yield support:
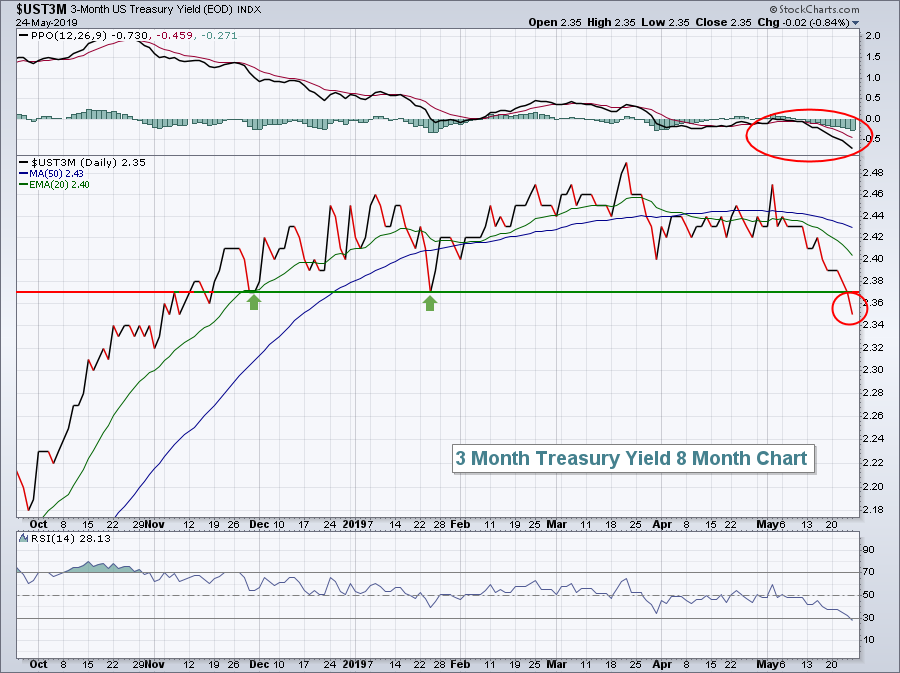 The UST3M is more closely tied to the federal funds rate and is clearly signaling to the Fed that the bond market wants a rate cut. Is the Fed listening? I believe the stock market would react very, very positively to a rate cut, but the Fed was stubborn in Q4 2018 before finally backing off its plan for multiple rate hikes in 2019. They'll likely be slow to react to bond traders once again, but I believe they'll eventually get it right once again.
Crude oil ($WTIC) is up just under 1% today, but still remains below $60 per barrel. Gold ($GOLD) is down about a half percent this morning, continuing its three month slide since peaking near $1350 per ounce.
Global markets were higher overnight and this morning and U.S. futures appear to be following suit after a back and forth morning. Currently, Dow Jones futures are higher by 35 points.
Current Outlook
Consumer staples (XLP) has gained more than 1% over the past month while the overall market has fallen, but that relative leadership is likely to wane as we move into June. Why? Well, for two reasons. First, I expect June to be a better month than May and defensive sectors like XLP tend to underperform. The second is the nasty negative divergence that has printed on its latest price breakout:
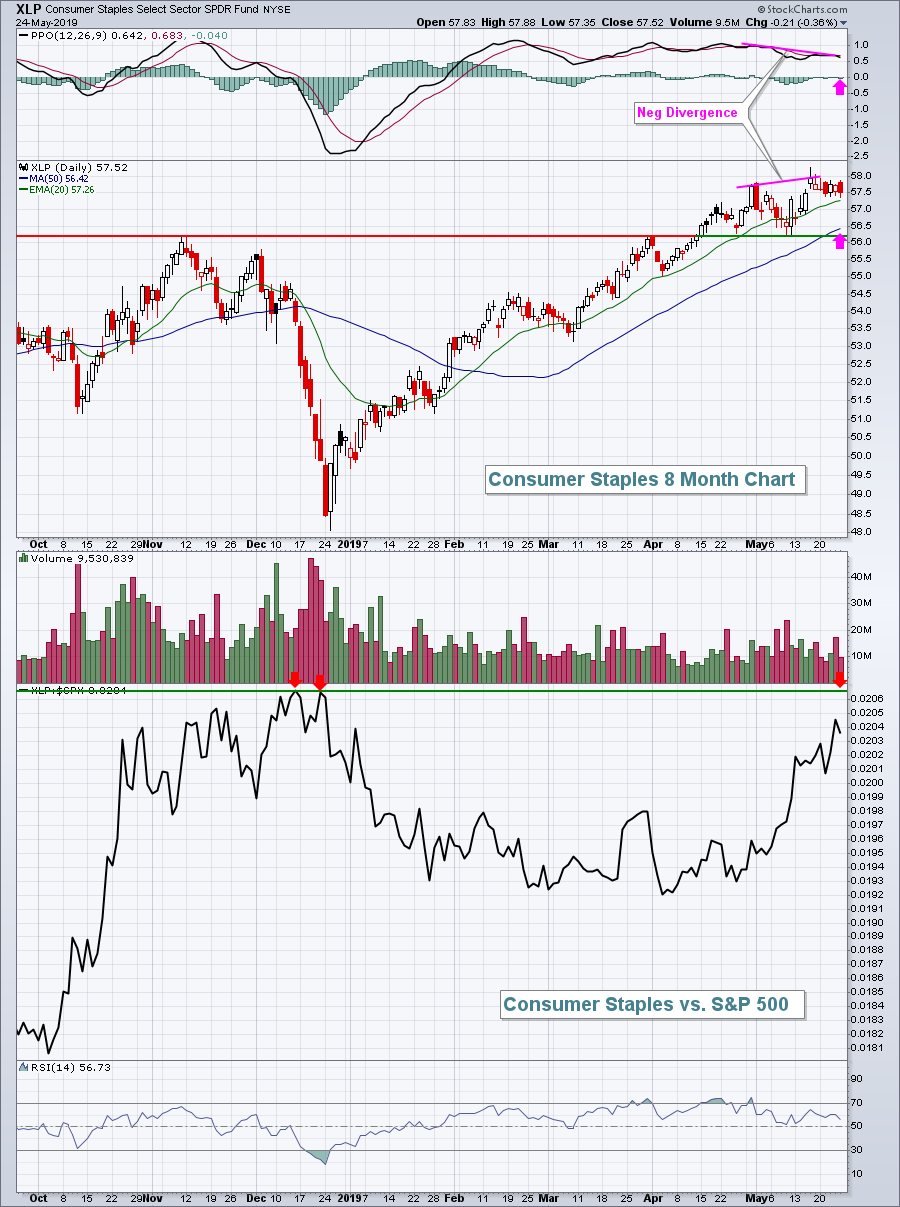 If you're looking for more weakness ahead in the benchmark S&P 500, a relative breakout in the XLP would be a confirming signal. That'll be something I watch closely. Given the negative divergence, a pullback to test the 50 day SMA, even price support near 56.20 is what I'll be looking for.
Sector/Industry Watch
Medical equipment stocks ($DJUSAM) showed great progress throughout January and February, but began to struggle with slowing price momentum (negative divergence) as it set new highs in March. That led to a period of selling, then consolidation. A symmetrical triangle is now in play as we await the directional breakout:
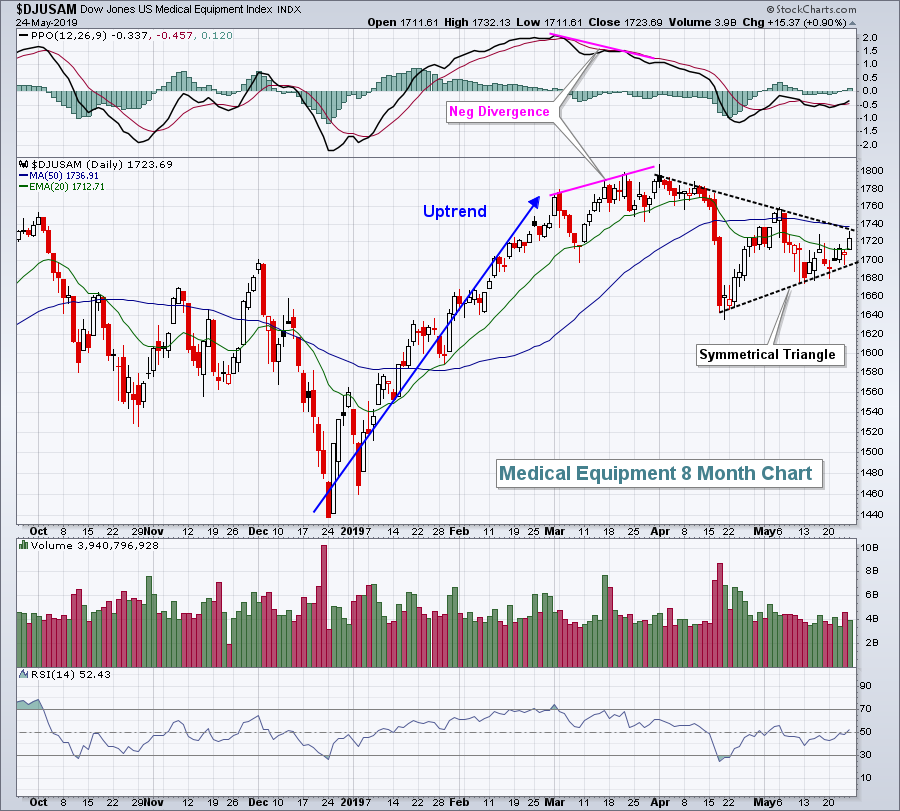 I'm expecting bullish confirmation and a break above 1740. One stock within the industry to pay particular attention to is Intuitive Surgical (ISRG). ISRG has been a relative laggard, but is now printing a positive divergence and is entering a very bullish seasonal period (see Historical Tendencies section below). Here's the technical picture:
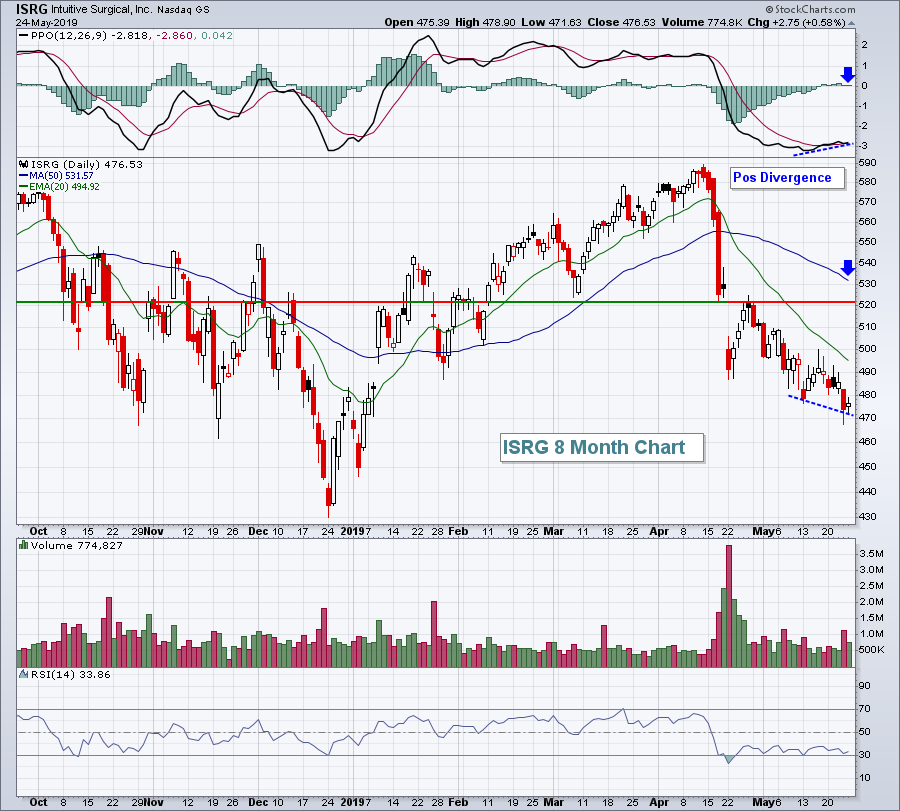 I'd still have difficulty buying ISRG here. Thursday's volume increased on its latest breakdown, so while price momentum appears to be slowing, the higher volume that accompanied the technical breakdown would argue that point. If the PPO rolls over again, expect a trip down to test price support closer to 430. A rally would likely make more sense there.
Monday Setups
Software ($DJUSSW) has been a strong performing group for quite awhile, so I'm going with a software stock that just broke to a recent high on Friday on expanding volume:
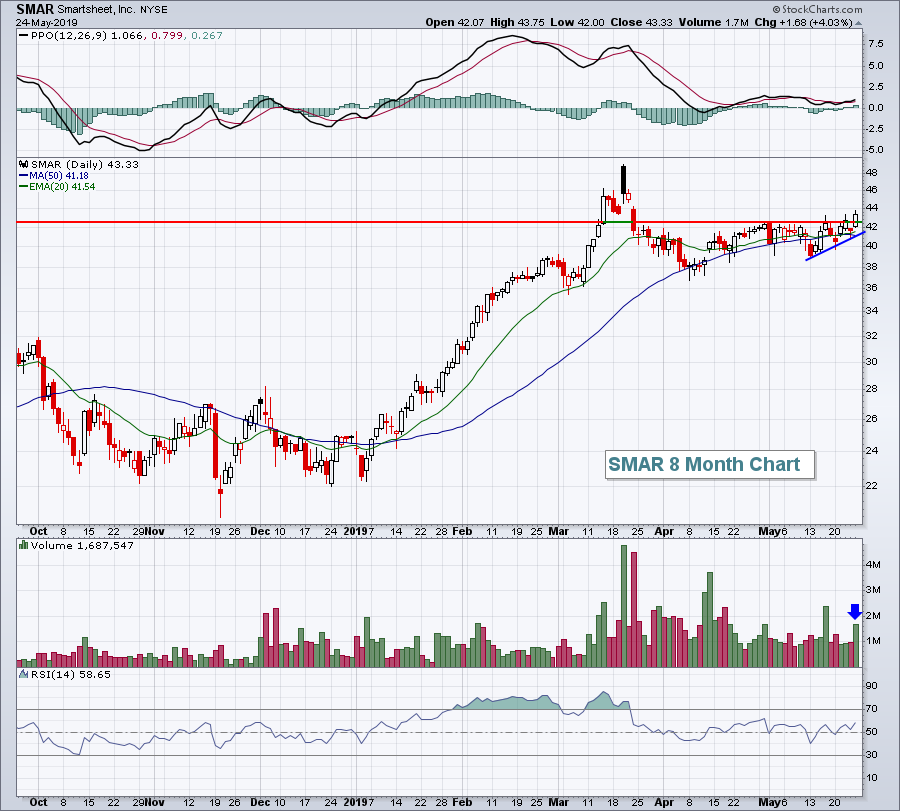 I believe Smartsheet, Inc. (SMAR) is poised to rally back to its open after its latest earnings report in March. That would take the stock back near 49 and would be my target. To the downside, both key moving averages are now above 41, so consider a closing stop beneath that level. To reduce risk, consider buying half at the current price and the other half closer to 41.50 - if it gets there. That would increase the reward to risk nicely. Of course, if it moves back to 49 without pulling back to the 41.50 level, then your reward is cut. It simply depends on how much risk you're willing to take.
SMAR is a volatile stock, so please position size accordingly if you decide to enter the trade.
Historical Tendencies
Intuitive Surgical (ISRG) is one of the best performing S&P 500 stocks in June and July. Over the past two decades, ISRG has posted average returns of 7.2% and 11.5% during June and July, respectively:
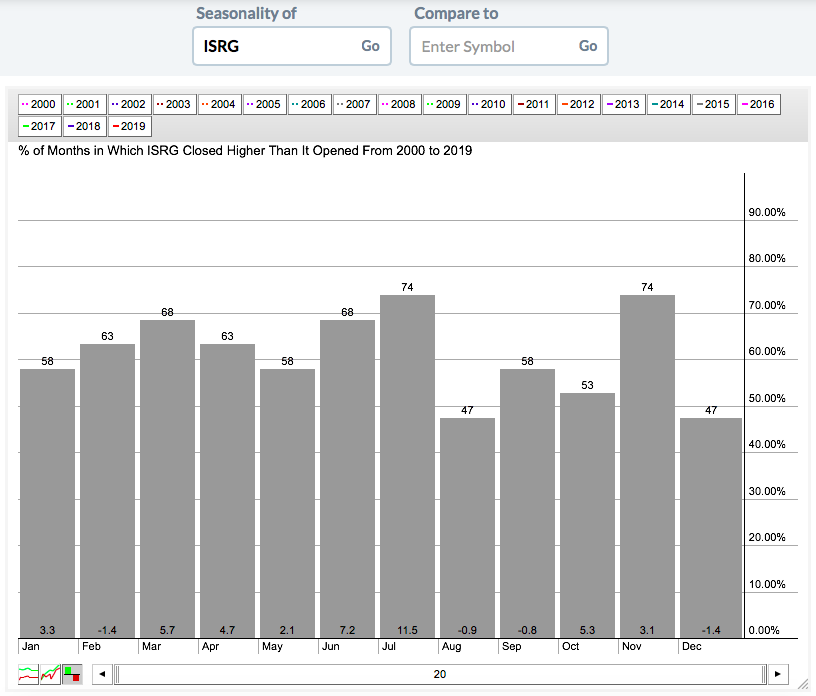 While the historical relative strength in summer is quite obvious from the above, we might want to wait for bullish technical confirmation. See Sector/Industry Watch section above for more details.
Key Earnings Reports
(actual vs. estimate):
BAH: vs .61
BNS: vs 1.29
MOMO: vs .55
PLAN: vs (.21)
(reports after close, estimate provided):
HEI: .49
RAMP: (.18)
WDAY: .41
YY: 1.45
Key Economic Reports
March Case Shiller HPI to be released at 9:00am EST: +0.2% (estimate)
May consumer confidence to be released at 10:00am EST: 129.8 (estimate)
Happy trading!
Tom
