Market Recap for Monday, April 29, 2019
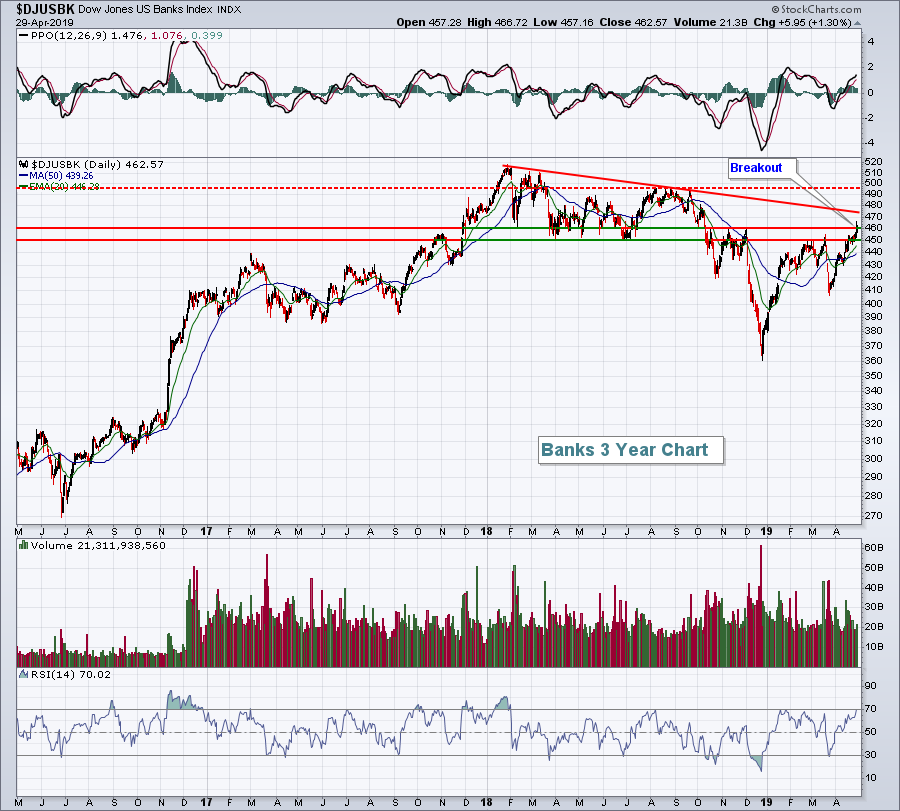
A bull market is comprised of a number of things, but two are wide participation and rotation of strength. We've been seeing both. Yesterday, it was financials (XLF, +1.01%) and communication services (XLC, +0.91%) that led the S&P 500 and NASDAQ to new record closing highs. Banks ($DJUSBK, +1.30%) were solid and technically broke out above a key area of congestion (450-460) on their chart:
 The good news here is we finally saw the DJUSBK close above 460. It's been a long time coming. But, as with any struggling sector, industry or individual stocks, there are a series of hurdles to overcome. The fact that we're in a bull market will certainly help, but the direction of the 10 year treasury yield ($TNX) will likely be the single largest influence for this group. There's still a trendline to negotiate near 475, then the summer highs from 2018 closer to 500. Yesterday was a start, though.
Economic reports on personal income and spending confirmed my belief that we're in a growing economy with little or no inflation. That latter part is very important because it will likely keep the Fed dovish. For equities, it doesn't get any better than a growing economy with a dovish Fed. Earnings and interest rates have always been the biggest factors in stock market performance and right now, both seem to be on the bulls' side.
Our sectors were split on Monday as real estate (XLRE, -1.03%) and utilities (XLU, -0.59%) lagged, holding back our major indices from larger gains.
One final note: The Russell 2000 ($RUT, +0.41%) is beginning to show signs of relative strength again as this small cap index closed at its highest level since mid-October. A close above 1600 could be the psychological catalyst to really trigger interest in this area of the market.
Pre-Market Action
Alphabet's (GOOGL) results after the bell are not helping the tech-laden NASDAQ in pre-market action, but Dow Jones futures are currently up 49 points with 30 minutes left to the opening bell. The 10 year treasury yield ($TNX) and gold ($GOLD) are relatively flat, but crude oil ($WTIC) is surging, up nearly 2% at last check.
Asia was mixed overnight and we're seeing modestly lower prices in Europe this morning.
Today marks the beginning of another Fed meeting. The policy statement will be released on Wednesday at 2pm EST.
Current Outlook
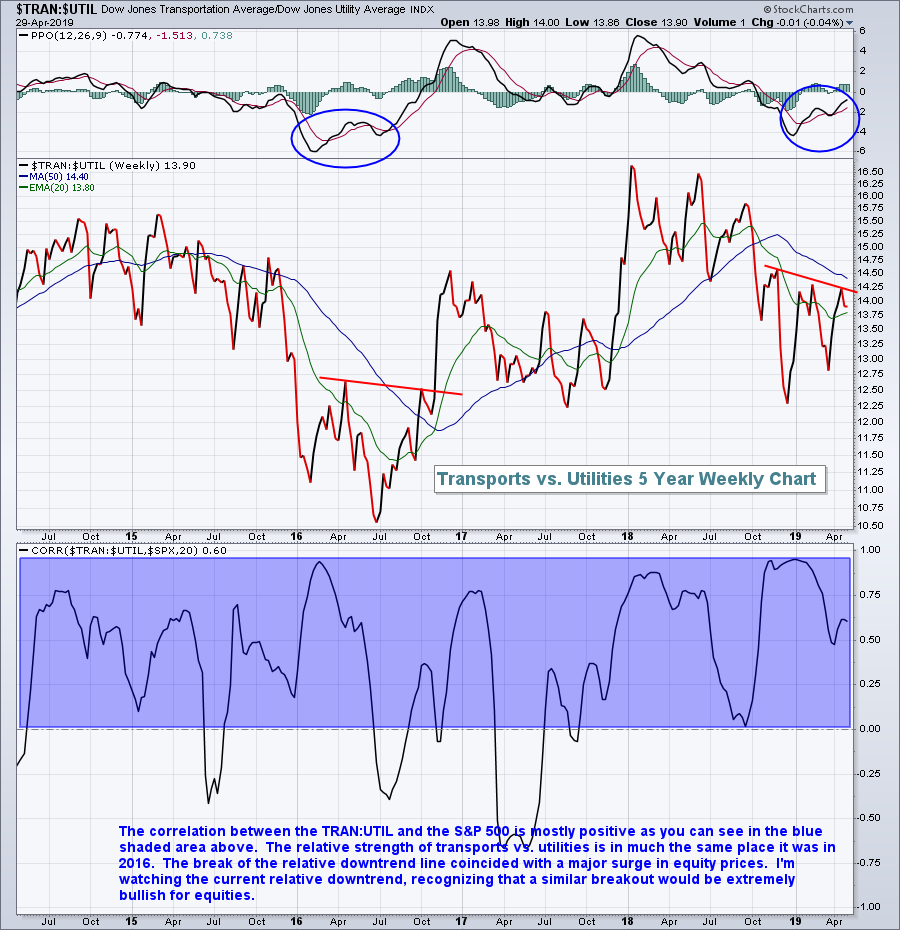
I review the XLY:XLP ratio quite often as a rising ratio is a signal of a "risk on" market environment, one in which we usually see very bullish market action. A secondary ratio to watch from time to time is transports vs. utilities ($TRAN:$UTIL) for much the same reason. In a strengthening economic environment or an environment where the market is anticipating future economic strength, money rotates away from utilities and into transportation stocks. The following chart is an illustration:
The correlation isn't perfectly positively correlated, but the blue shaded area on the chart certainly shows its positively correlated more often than not. The current relationship reflected by the TRAN:UTIL is quite similar to 2016. If this current bull market is missing one ingredient, I'd say it's been the lack of strength in transports (other than railroads). We've seen significant sudden surges in this ratio twice over the past five years - in Q4 2016 and in late-2017. Both times, U.S. equities surged as well and that's no coincidence in my opinion. Let's be on the lookout for a breakout in this ratio as it could spell yet another major leg higher in an already hot stock market.
Sector/Industry Watch
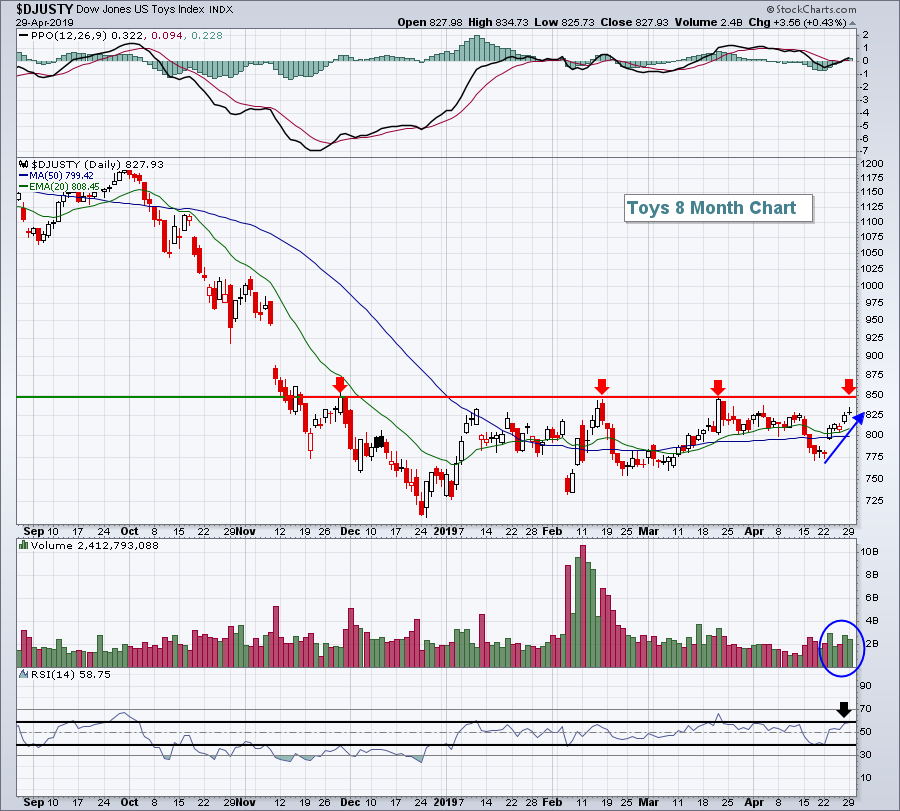
Toys ($DJUSTY) have been the best performing industry group over the past week, rising more than 6%. Technically, the group is approaching a very important price resistance level near 850:
 The DJUSTY has been trendless for several months now and the RSI staying mostly between 40 and 60 confirms this. Volume has been picking up, however, during this one week winning streak, indicating the possibility of accumulation. I need to see the breakout above 850 to grow more bullish.
Historical Tendencies
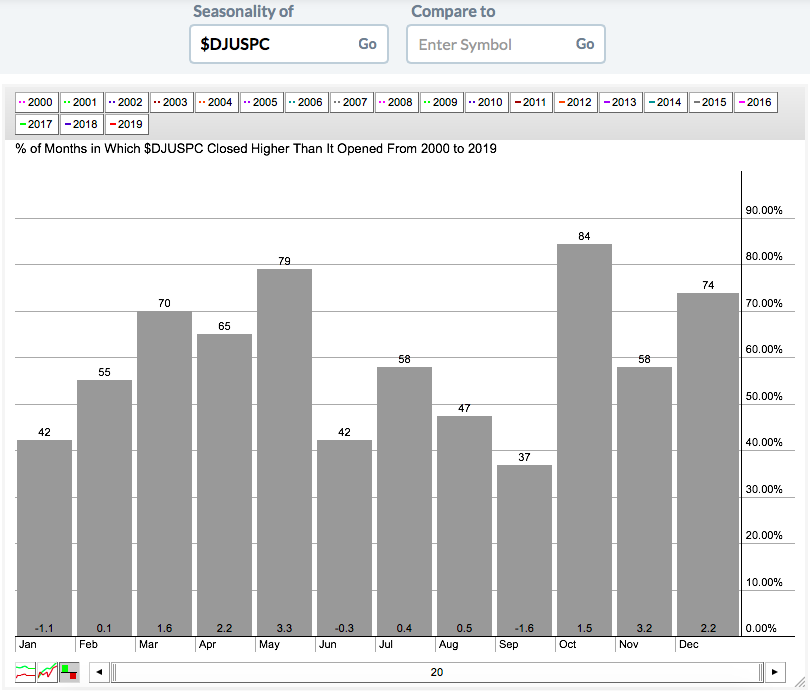
The Dow Jones U.S. Waste & Disposal Services Index ($DJUSPC) has been a strong performer, rising close to 30% off the December low. Seasonally, the DJUSPC picks up strength from January through May before slowing down for summer. Here are the numbers:
 U.S. equities have a history of performing well during May. If that track record holds true in 2019, look for the DJUSPC to be a part of the bullish action.
Key Earnings Reports
(actual vs. estimate):
BHGE: .15 vs .14
BP: .70 vs .68
BSBR: .22 - estimate, awaiting results
CHTR: 1.11 vs 1.34
CMI: 4.20 vs 3.51
COP: 1.00 vs .92
ECL: 1.03 vs 1.02
ETN: 1.26 vs 1.25
FDC: .31 vs .31
FIS: 1.64 vs 1.57
GE: .14 vs .09
GLW: .40 vs .39
GM: 1.41 vs 1.09
HCA: 2.97 vs 2.31
INCY: .62 vs .39
IR: .89 vs .79
KKR: .38 vs .37
LDOS: 1.13 vs .99
LH: 2.62 vs 2.53
LLY: 1.33 vs 1.32
MA: 1.78 vs 1.66
MCD: 1.78 vs 1.73
MLM: .68 vs .29
MRK: 1.22 vs 1.05
PCAR: 1.81 vs 1.66
PFE: .85 vs .77
PSX: .40 vs .34
SHOP: .09 vs (.05)
SPG: 3.04 vs 3.02
STX: .83 vs .72
WCG: 3.69 vs 3.10
WELL: 1.02 vs 1.02
ZBRA: 2.92 vs 2.87
(reports after close, estimate provided):
AAPL: 2.37
ACGL: .62
AKAM: 1.02
AMD: .05
AMGN: 3.45
BFAM: .79
BXP: 1.66
CB: 2.49
CHRW: 1.13
CXO: .73
DVN: .30
EIX: .88
EQR: .81
EXAS: (.64)
EXR: 1.14
FICO: 1.63
FISV: .82
JKHY: .77
MDLZ: .61
MKL: 9.41
MXIM: .52
OKE: .73
PAYC: 1.12
SSNC: .88
TWLO: .01
UDR: .50
UNM: 1.31
VRSK: 1.04
VRTX: .98
WES: .47
ZEN: .03
Key Economic Reports
February Case Shiller HPI to be released at 9:00am EST: +0.3% (estimate)
March Chicago PMI to be released at 9:45am EST: 59.0 (estimate)
April consumer confidence to be released at 10:00am EST: 127.1 (estimate)
March pending home sales to be released at 10:00am EST: +0.7% (estimate)
Happy trading!
Tom

