Market Recap for Monday, March 18, 2019
U.S. stocks moved modestly higher on Monday, extending Friday breakouts on both the S&P 500 (+0.37%) and NASDAQ (+0.34%). The Russell 2000 gained 0.67% to lead the action. Crude oil prices ($WTIC, +1.47%) topped $59 per barrel as energy shares (XLE, +1.39%) were atop the sector leaderboard. But it wasn't all about energy. Financials (XLF, +1.01%), industrials (XLI, +0.97%) and consumer discretionary (XLY, +0.97%) - three aggressive sectors - all performed exceptionally well. The laggards were primarily defensive groups, although the worst performing sector was communication services (XLC, -0.85%), dragged down by Facebook (FB, -3.32%) and a weak internet group ($DJUSNS, -1.04%). FB needs to be monitored closely as it's on the verge of losing price and 50 day SMA support:
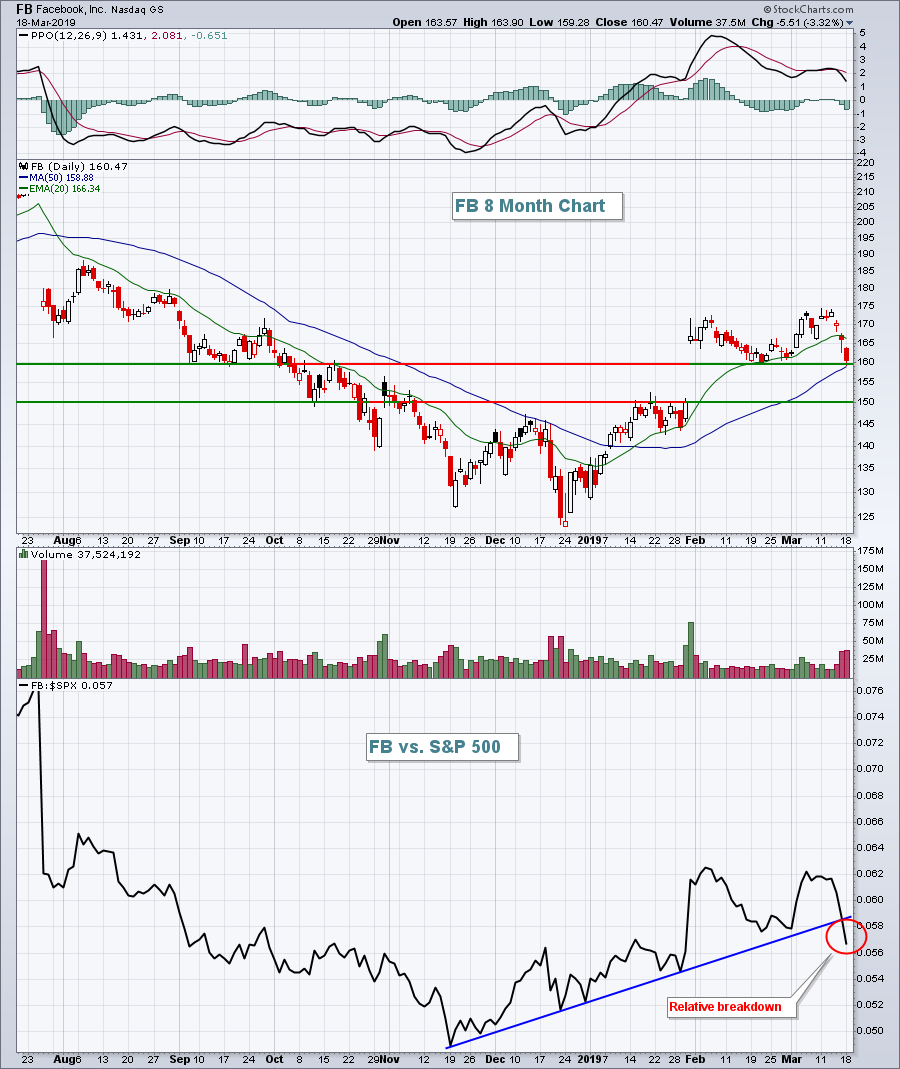 FB broke down on a relative basis, so if it loses its current price and 50 day SMA support, look next to gap support being filled near 150.
One interesting development on Monday was the breakout of broadline retailers ($DJUSRB, +1.65%). Amazon.com (AMZN, +1.74%) finally cleared its range of congestion and we know what happened to both Apple, Inc. (AAPL) and Alphabet (GOOGL) when they cleared price resistance. They kept rallying. Here's a current look at AMZN:
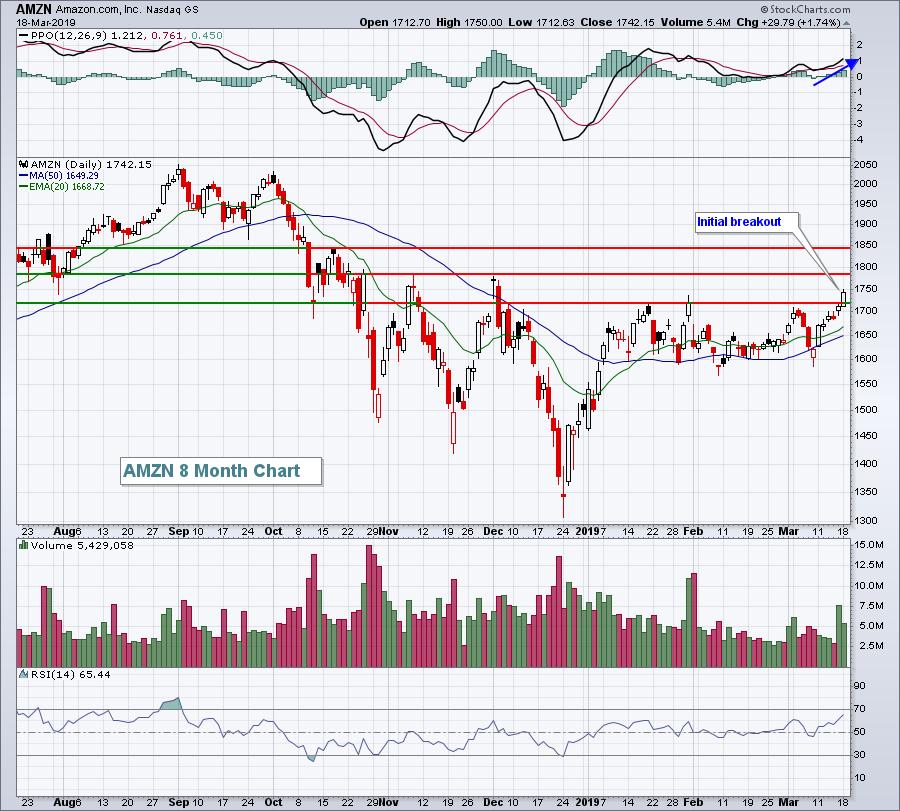 AMZN has a couple more price levels to clear, but you can't reach the second or third price resistance level without clearing the first one. Momentum appears to be strengthening and I would expect to see more momentum traders jumping on this bandwagon.
One last note. The Federal Reserve starts its latest meeting this morning with its policy statement to be released on Wednesday at 2pm EST. I highly doubt we'll see a change in the fed funds rate, but traders will be looking for the Fed to provide an update regarding possible future hikes - how many and when.
Pre-Market Action
Asian markets were mixed overnight, but there's a solid bid in Europe this morning with the German DAX ($DAX) up more than 1% at last check. Crude oil ($WTIC) is fractionally higher, while the 10 year treasury yield ($TNX) has spiked 3 basis points to 2.63% ahead of the Fed meeting.
U.S. futures look solid this morning with Dow Jones futures higher by 91 points with 30 minutes left to the opening bell.
Current Outlook
There are negative divergences emerging all over the stock market, but let's just focus on the benchmark S&P 500 for now. First, check out the daily chart:
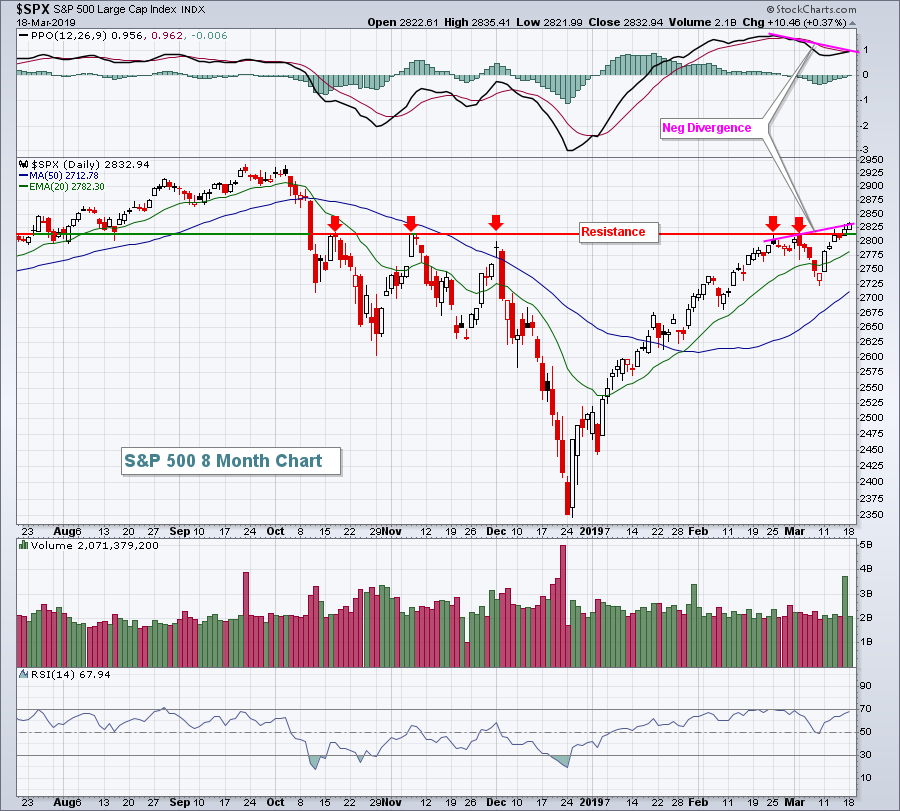 Overhead price resistance near the 2817 level was finally cleared. That's the good news and really shouldn't be taken lightly. But failure to hold that breakout with a negative divergence in place would not be good news at all for the short-term, so watch 2817 closing support. That potential failure could lead to a retest of the 2725 price level where buyers returned on March 8th.
A further red flag is the negative divergence that the S&P 500 has printed on its hourly chart:
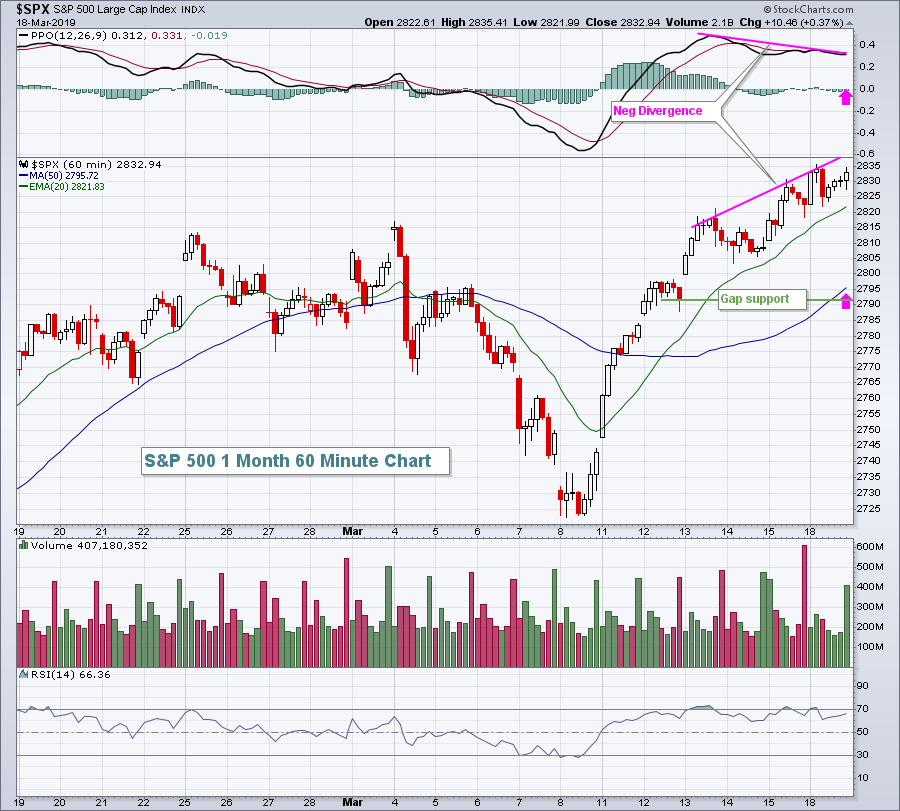 Listen, negative divergences do not guarantee us anything. They simply warn us of higher risks. Therefore, if you're a risk averse short-term trader, then these are signs that should concern you. If you're a long-term trader or someone who buys and holds for longer-term capital appreciation, then I'd mostly ignore these signs as I believe the market goes higher as we look further down the road.
Be sure to subscribe to my blog. Scroll down to the bottom of this article, type in your email address in the box provided and click on the green "Subscribe" button. It's free and, once subscribed, my blog articles will be sent immediately sent to your email address upon publishing. Thanks!
Sector/Industry Watch
During the beginning of MarketWatchers LIVE yesterday, I spent 5-10 minutes detailing the negative divergences that are present in so many areas of the market. As a result, I've moved much more into cash as a short-term precaution. I still believe the stock market is heading higher and will be in all-time high territory by summer, but the risks of holding short-term positions right now are high because of slowing momentum indications. One group that continues to look solid, however, is mobile telecommunications ($DJUSWC):
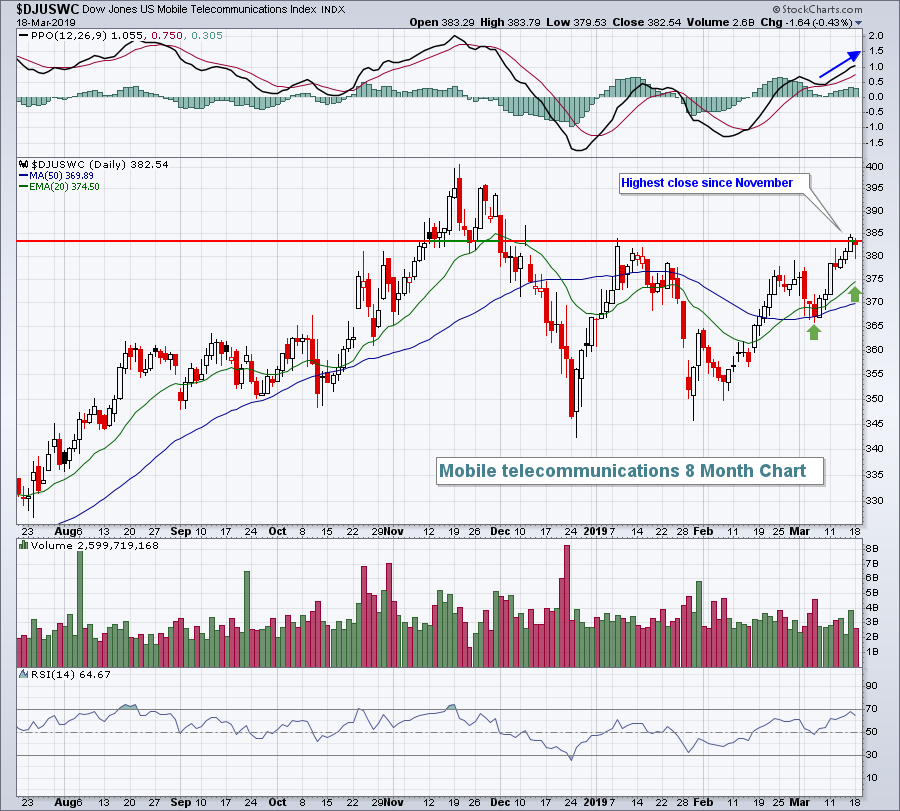 Should the overall market see short-term selling, I'd expect to see the DJUSWC hold support at its rising 20 day EMA. Areas of the market that have negative divergences would be more likely to fall back to 50 day SMAs.
Historical Tendencies
We're in a favorable time of the year for mobile telecommunications ($DJUSWC) as the group has averaged gaining 1.1%, 3.0%, and 2.5% during March, April, and May, respectively, over the past 20 years:
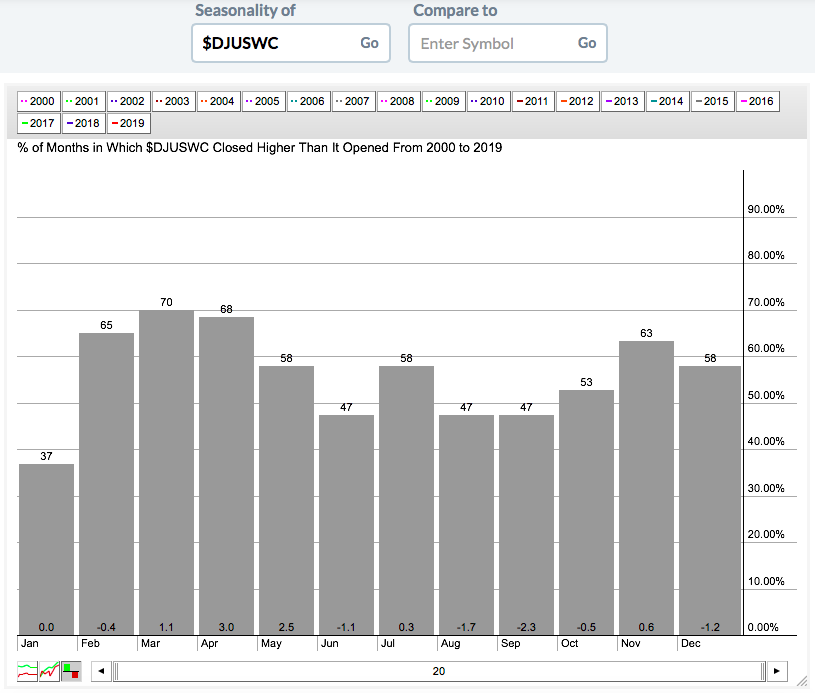 It's also one of the best looking groups technically right now as discussed above in the Sector/Industry Watch section.
Key Earnings Reports
(actual vs. estimate):
HDS: .70 vs .67
(reports after close, estimate provided):
FDX: 3.10
FNV: .26
SMAR: (.14)
TME: .08
Key Economic Reports
FOMC meeting begins
January factory orders to be released at 10:00am EST: +0.0% (estimate)
Happy trading!
Tom
