Market Recap for Friday, March 15, 2019
It was another solid day for the bulls to close out last week. It was also quad-witching options expiration Friday, which typically results in much-heavier-than-usual volume. Volume was certainly heavy on Friday. Leadership was found in the aggressive NASDAQ, which jumped 0.76%. The Dow Jones and S&P 500 followed with gains of 0.54% and 0.50%, respectively, while the small cap Russell 2000 lagged again, rising just 0.25%. The Russell 2000's poor relative performance is a concern and is illustrated in the Current Outlook section below.
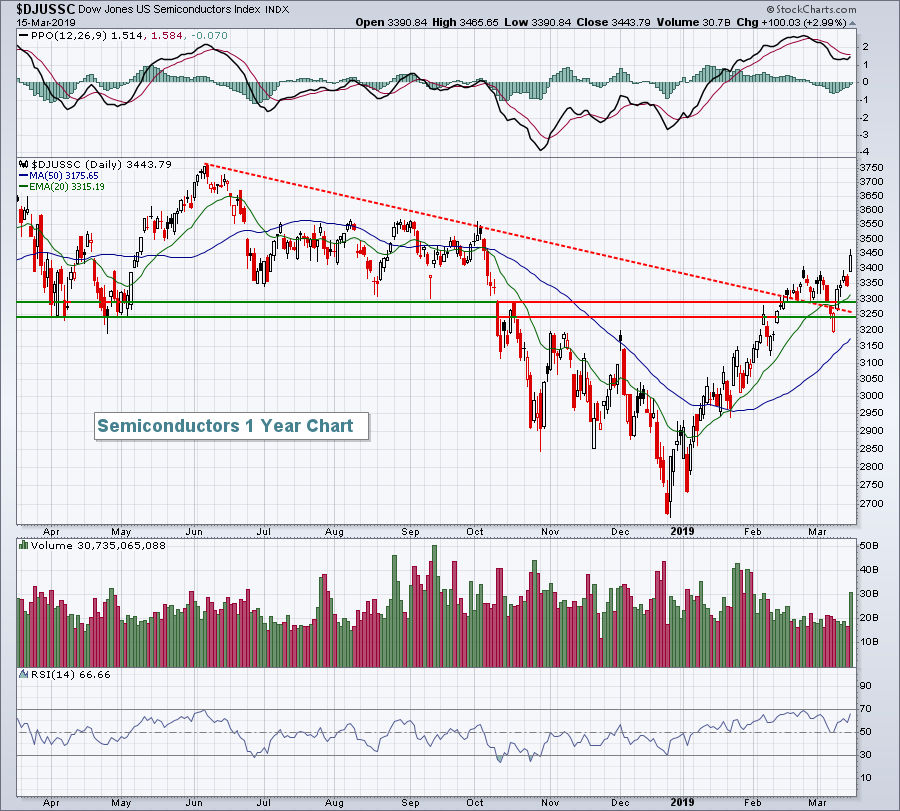
Technology (XLK, +1.21%) was Friday's leader and the XLK has had a strong 2019 campaign thus far, surging more than 18% since the start of the year. This time it was semiconductors ($DJUSSC, +2.99%), breaking to their highest level since October 2018:
 I had viewed resistance in the 3250-3300 level to be important. We broke above it in February, temporarily dropped back beneath it earlier this month and we've now surged back above it to fresh new 2019 highs. The DJUSSC has also been showing solid relative strength in 2019. Leadership from this group is typically a sign of more gains ahead.
Most sectors finished higher on Friday, although we did weakness in real estate (XLRE, -0.41%) and industrials (XLI, -0.35%).
Pre-Market Action
Boeing (BA) is down more than 2% in pre-market action in what is becoming a normal morning occurrence. The aerospace giant is having a negative impact on Dow Jones futures, which are lower by 40 points as we approach the opening bell. S&P 500 and NASDAQ futures are pointing to fractional gains at the open.
The 10 year treasury yield ($TNX) closed beneath 2.60% last week, but is up slightly to 2.61% this morning. Crude oil ($WTIC) is up slightly and approaching $59 per barrel.
Asian markets were strong, especially China's Shanghai Composite ($SSEC), which jumped 2.47% overnight. Europe is mixed and more reflective of the early pre-market action here in the U.S.
Current Outlook
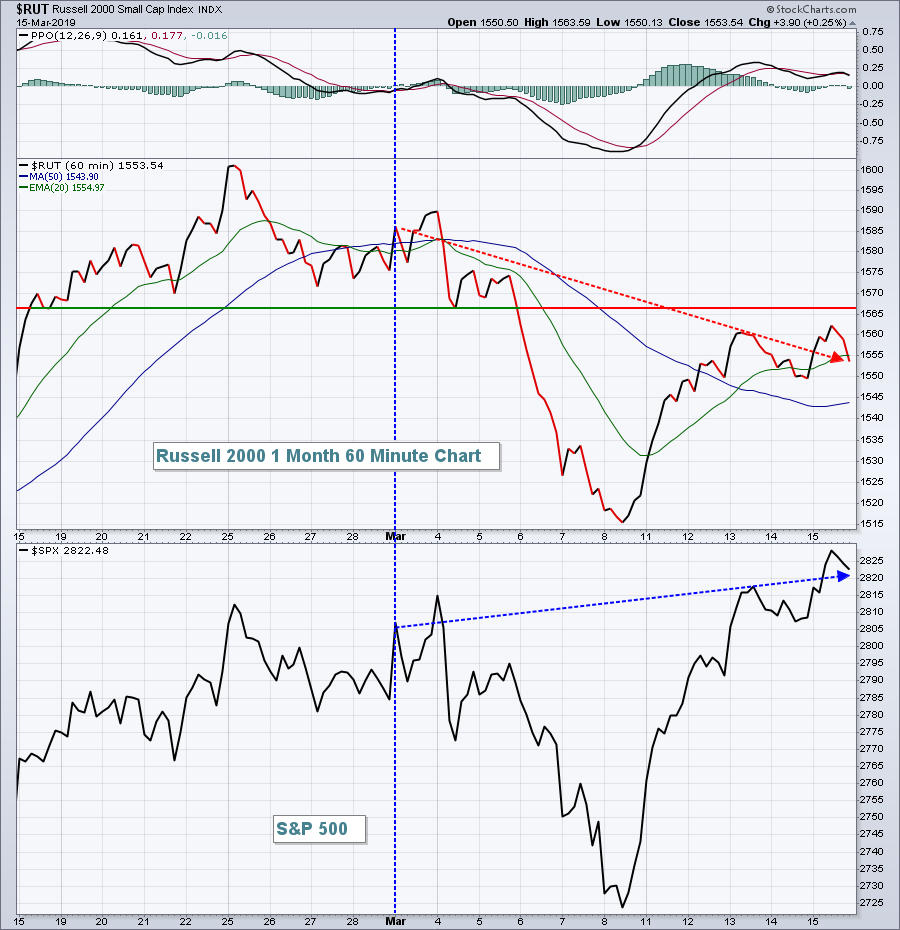
March is typically kind to small cap stocks (Russell 2000) as it's one of best calendar months historically for this group. March 2019 has not been kind, however. The following one month chart shows much better performance on the S&P 500:
 The Russell 2000 broke down in early March below 1567 and it hasn't been able to close above that level since. Meanwhile, the S&P 500 has broken out above the early March highs. I like to see small caps outperform so this is one chart that tells us to at least consider the possibilitiy that equities are not ready to storm to all-time highs.
Sector/Industry Watch
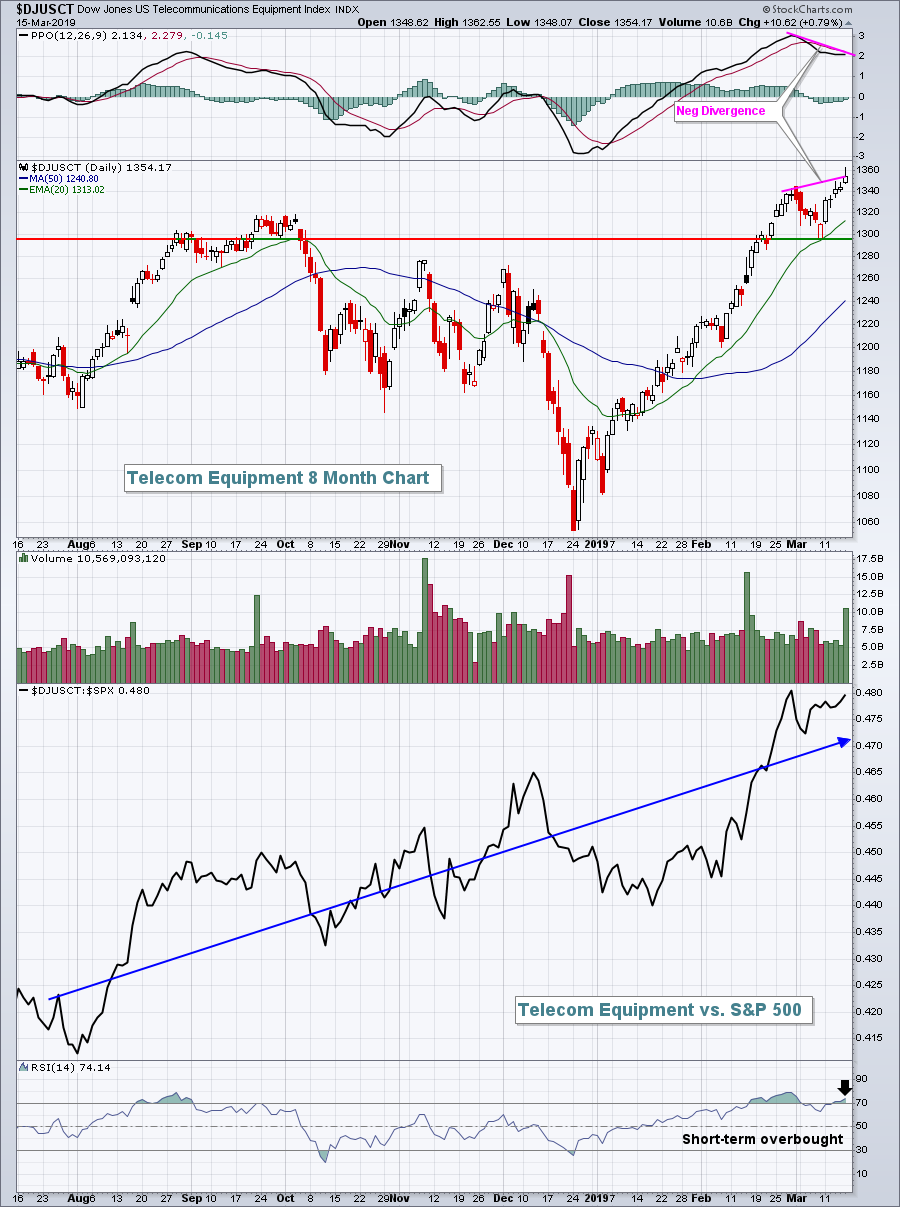
The Dow Jones U.S. Telecommunications Equipment Index ($DJUSCT) has been a market leaders for quite awhile, but it is showing signs of deteriorating momentum that could result in a period of consolidation:
 If you look back to the beginning of October, you'll see that the DJUSCT was setting a new high with a lower PPO. Check out what happened to its relative strength for the next two weeks. It lost considerable ground relative to the S&P 500. There's no guarantee we see that now, but the odds are increasing.
Monday Setups
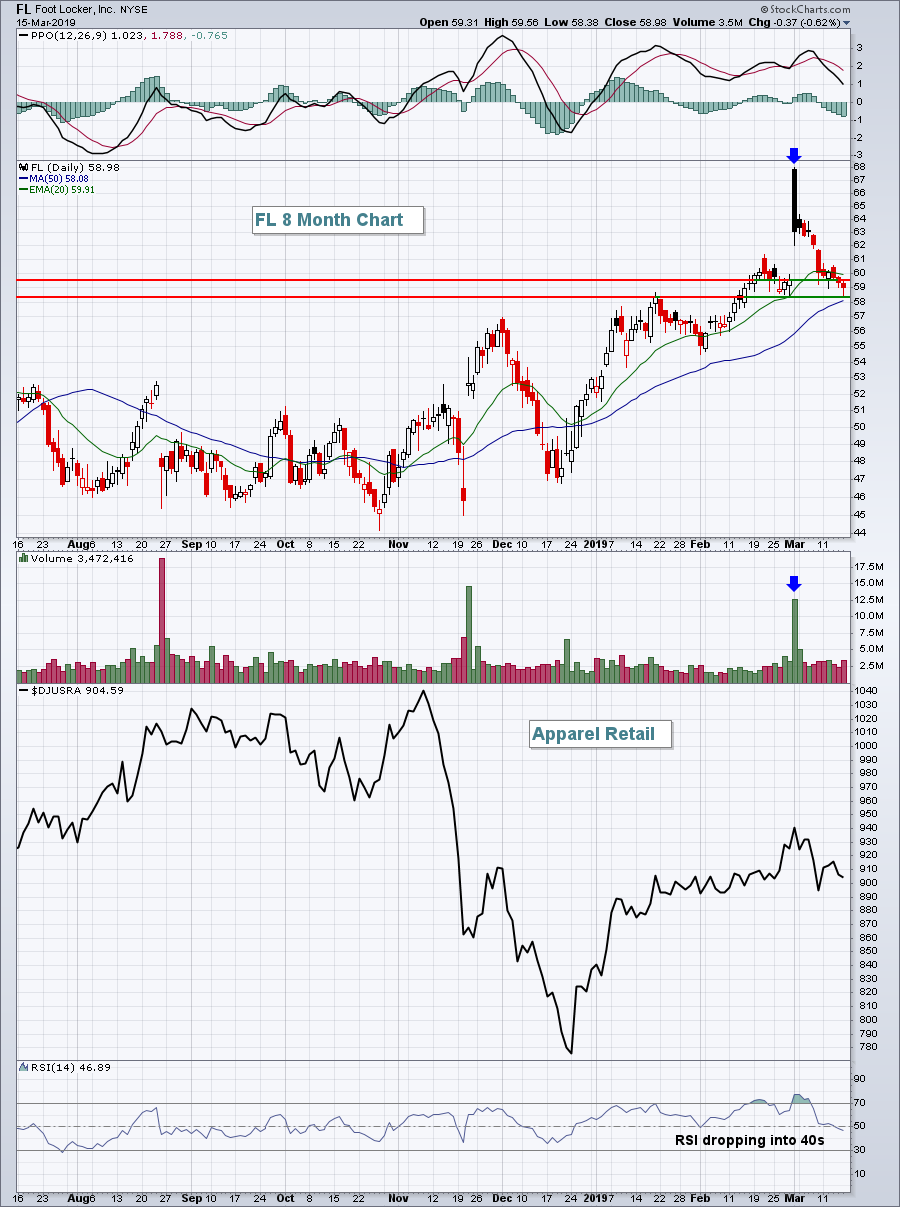
After a huge earnings-related gap higher a couple weeks ago, Foot Locker (FL) has been under considerable selling pressure. I think that will change this week. I would look for a rebound sooner rather than later:
 FL's peer group, apparel retail ($DJUSRA), has been a challenge as the group overall is flat in 2019, but FL has been a clear leader. Still, the group's weakness has probably led to the selling we've seen since earnings were reported. Price and gap support are now being tested, however, and this is where I'd look for buyers to re-emerge.
Historical Tendencies
Options expired on Friday. As I wrote about in ChartWatchers over the weekend, this can be a difficult week (week after options expiration) for equities. Since 1950, the week after options expiration has produced annualized returns of -2.61% on the S&P 500. That's 11 percentage points below the average 9% annual return that the S&P 500 has enjoyed over the past seven decades.
Key Earnings Reports
(reports after close, estimate provided):
HQY: .22
STNE: .13
TLRY: (.14)
Key Economic Reports
March housing market index to be released at 10:00am EST: 63 (estimate)
Happy trading!
Tom
