Market Recap for Monday, February 4, 2019
Technology (XLK, +1.60%) led another broad-based rally on Wall Street Monday as all of our major indices closed higher. There was particularly strong action on the aggressive NASDAQ and Russell 2000 as they gained 1.15% and 1.03%, respectively. 9 0f 11 sectors finished higher with only healthcare (XLV, -0.29%) and materials (XLB, -0.17%) failing to participate.
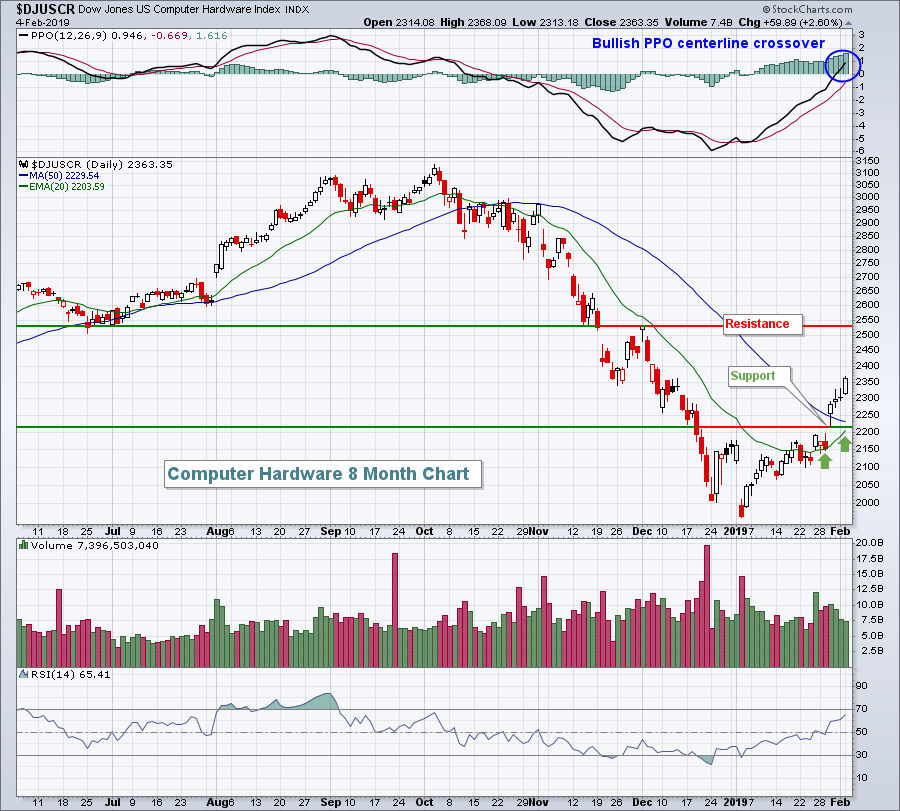
Computer hardware ($DJUSCR, +2.60%) rallied on the back of Apple, Inc. (AAPL, +2.84%), which continued its post-earnings surge. Roku (ROKU, +4.91%) and Mercury Systems (MRCY, +4.72%) provided big boosts to the group as well. The latter released a very strong earnings report late last week, breaking out from months of sideways consolidation. As I mentioned last week on MarketWatchers LIVE, I believe MRCY released one of the best earnings reports of earnings season thus far. Traders apparently are agreeing. The DJUSCR appears headed higher to test overhead price resistance from the early December reaction high:
Software ($DJUSSW, +2.26%) also had a very strong day on Monday, clearing recent price resistance and overhead trendline resistance:
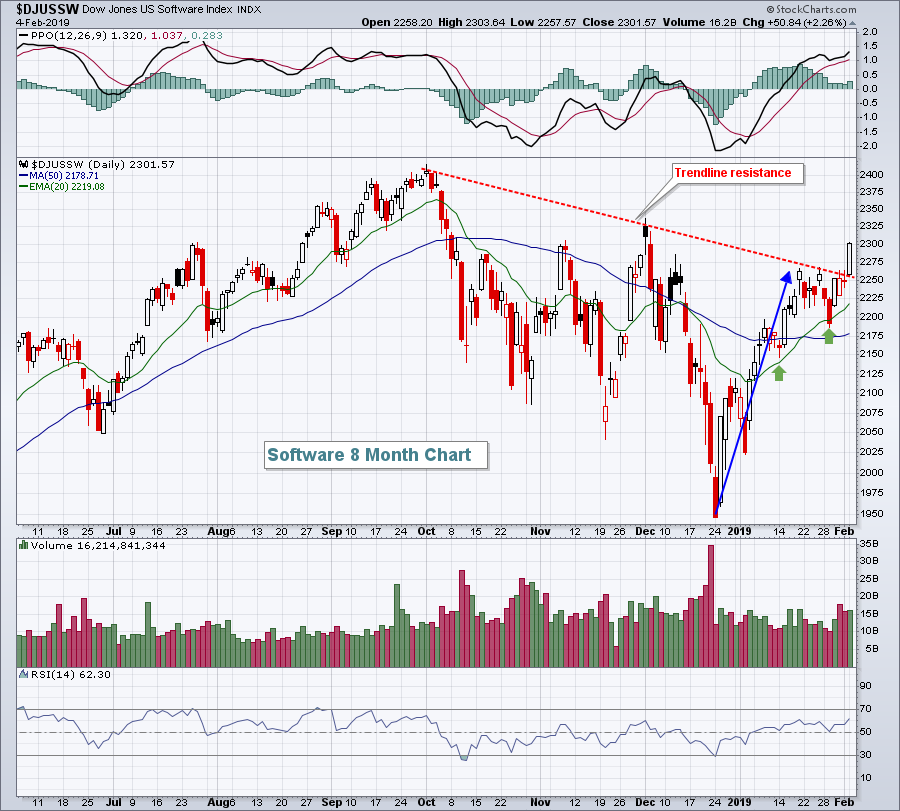 Since the heavy October selling, the DJUSSW has had only one close above 2300 and that was on December 3rd. That resistance near 2325 is the only thing technically that stands between the current price and a test of the all-time high in October. It's crazy how much the technical picture has changed in the last 6 weeks.
Industrials (XLI, +1.29%) had a solid day as well, led by defense stocks ($DJUSDN, +3.06%). The DJUSDN is reviewed in more detail in the Sector/Industry Watch section below.
Pre-Market Action
The 10 year treasury yield ($TNX) is flat this morning as economic news will be light. Crude oil ($WTIC) is down a bit more than 1% to $53.97 per barrel. Asian markets were mixed overnight, but European markets are very strong. The German DAX ($DAX) is up 118 points, or 1.06%, to 11295 as global technical conditions improve. While the percentage recovery on the DAX is not what we've seen on the S&P 500, the DAX does now trade back above its 20 day EMA and that moving average has crossed back above the 50 day SMA (golden cross). Clearly, we've seen improvement in the international index that has most closely mirrored the S&P 500 over the past decade.
Dow Jones futures are higher by 95 points with 30 minutes left to the opening bell.
Current Outlook
The U.S. Dollar Index ($USD) fell throughout 2017 and rose mostly during 2018. Thus far, the dollar can't seem to make up its mind in 2019:
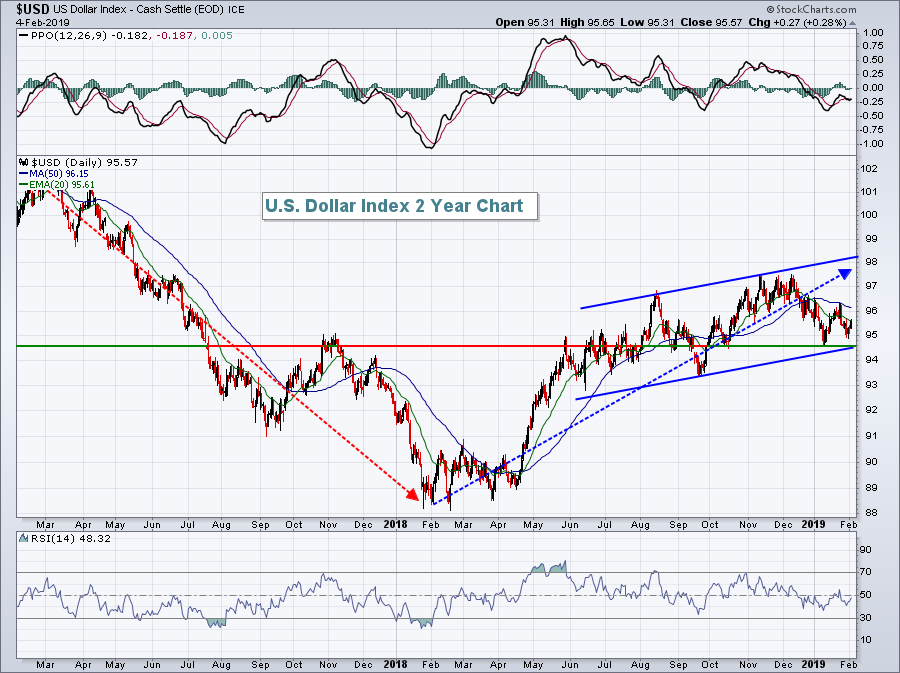 I'm watching the current channel for directional clues on the USD. The channel was established by connecting the highs established in August and November and then dragging a duplicate line lower to connect the September low. At that same slope, this lower channel would intersect near 94.50 currently and that's where our latest price low in January occurred. So long as the dollar continues to drift in the bottom of this channel, I'd expect gold ($GOLD) to perform well. Gold has been exceptionally strong since the dollar's top in November, finished yesterday at $1319 per ounce, and has a reasonable chance to test overhead resistance in the $1370-$1380 per ounce range.
Sector/Industry Watch
Defense stocks ($DJUSDN) were among the worst performers in Q4 2018, but the group is on a roll now and should be considered for trades so long as rising 20 day EMA support continues to hold:
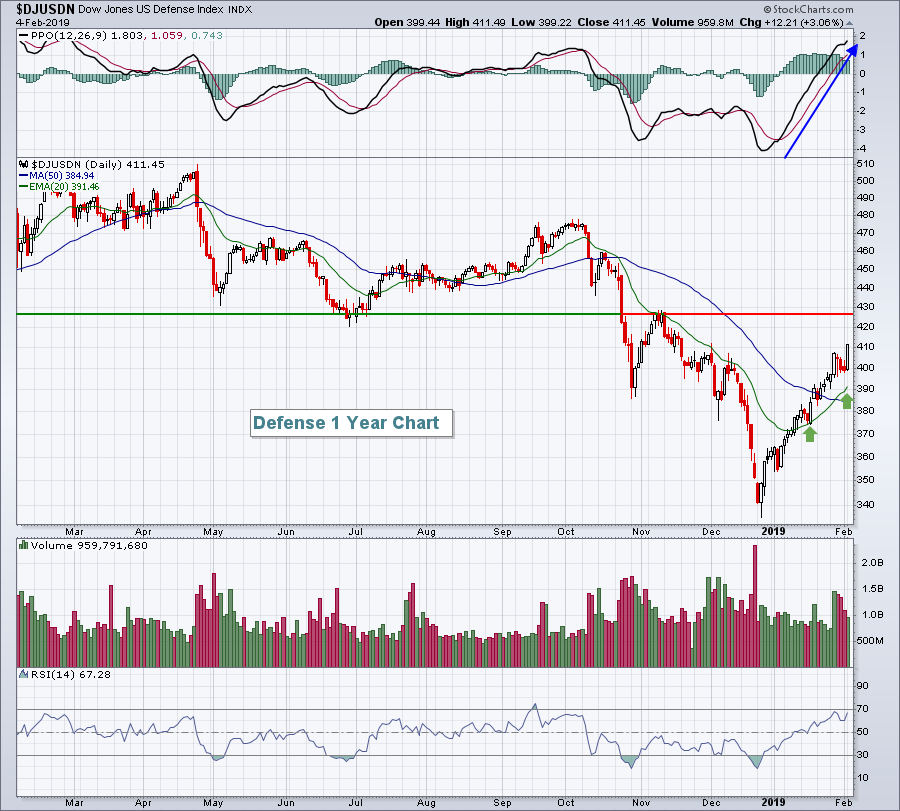 The PPO has strengthened considerably and now resides above its centerline, suggesting accelerating bullish momentum. The daily RSI is nearing 70, so a short-term pullback could be in order, but a trip to 430 cannot be ruled out before we see potential sellers step in.
Historical Tendencies
The energy ETF (XLE) cleared price resistance at 64.00 and now enters its best time of the year in terms of relative performance. Check this out:
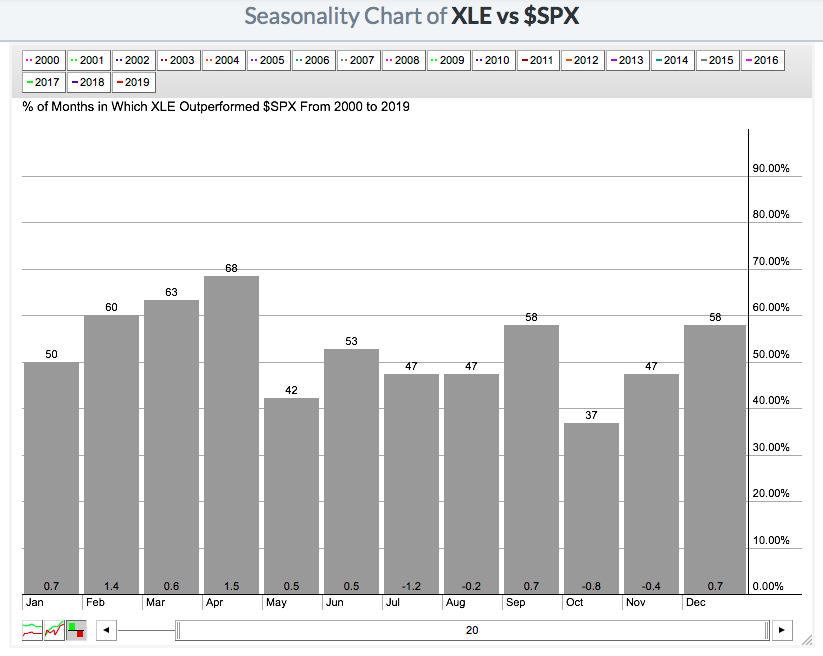 The numbers at the bottom of each calendar month highlight the relative performance of the XLE vs. the S&P 500. For instance, February shows that the XLE outperforms the SPX by an average of 1.4% over the last 20 years. The outperformance continues in every month during the first half of the year, but is particularly concentrated from February through April.
Key Earnings Reports
(actual vs. estimate):
ADM: .88 vs .92
AME: .86 vs .84
BDX: 2.70 vs 2.58
BP: 1.04 vs .78
CHD: .57 vs .58
CNC: 1.38 vs 1.33
EL: 1.74 vs 1.54
EMR: .74 vs .66
IT: 1.20 vs 1.25
TDG: 3.85 vs 3.35
VIAB: 1.12 vs 1.02
WCG: 1.63 vs 1.55
(reports after close, estimate provided):
ALL: 1.01
APC: .57
ATO: 1.33
CB: 1.93
CERN: .63
DATA: (.08)
DIS: 1.57
DLR: 1.67
EA: 1.93
JKHY: .85
MCHP: 1.57
MKL: 3.31
PAA: .69
SNAP: (.08)
SU: .38
SWKS: 1.84
VRTX: 1.05
Key Economic Reports
January PMI services index to be released at 9:45am EST: 54.2 (estimate)
January ISM non-manufacturing index to be released at 10:00am EST: 57.1 (estimate)
Happy trading!
Tom

