Market Recap for Friday, January 4, 2019
Friday was a HUGE day for the bulls as nonfarm payrolls came in well ahead of expectations (312,000 vs 180,000), which in no way reflects what the stock market has been saying since Q4 2018 began - that we were heading towards slowing economic growth. That simply was not the case with this jobs report. To add more fuel to the fire, Fed Chair Jerome Powell (who served as the lead role in How The Grinch Stole Christmas), backed off earlier statements and exercised patience. Powell now is indicating that he's understanding the market's message, but that he's not yet seeing the data to support that message. Not only did he suggest that he'll be more data dependent, but also even indicated that the $50 billion reduction in the Fed's balance sheet was not a definite, especially if data began pointing to a 2019 economic slowdown.
The stock market loved both of these developments, which resulted in the Dow Jones, S&P 500, NASDAQ and Russell 2000 simultaneously surging 3.29%, 3.43%, 4.26%, and 3.75%, respectively. All 11 sectors gained at least 1% and gold mining ($DJUSPM, -0.06%) was the only industry group to finish the day in negative territory. The bulls SWAMPED the bears.
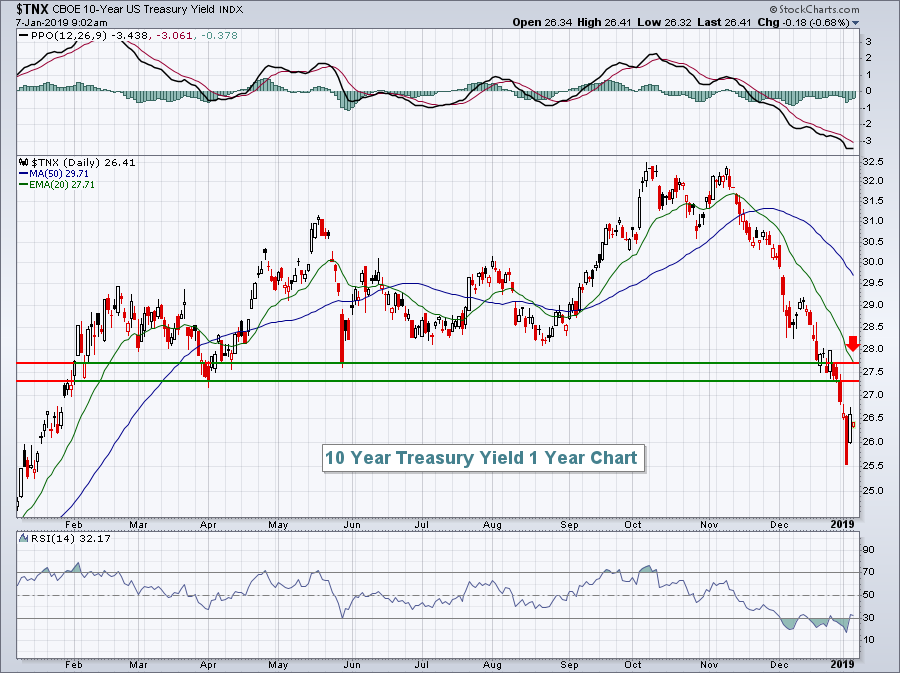
While it doesn't make much sense to highlight individual groups that exploded on Friday, perhaps the biggest development was the treasury market finally selling off. There was a huge drop in bond prices, with resulting yields exploding higher. That rotation from bonds to equities was perhaps most responsible for the massive gains in equities. The 10 year treasury yield ($TNX) easily had its best day in months:
 We're two basis points lower this morning, but the huge rally in yields last week is quite apparent. Technically, will the TNX push back above the 2.73%-2.77% resistance area. Until that happens, I wouldn't take the equity rally too seriously.
Pre-Market Action
Crude oil ($WTIC) continues to rally this morning, up another 2.38% to $49.10 per barrel. I'd look for resistance to kick in between $50-$54 per barrel. There was a positive divergence on the WTIC that I've written about and discussed recently. That could result in a test of price resistance in the range above.
Asian markets were higher overnight, in hopes of more successful trade talks between the U.S. and China, which are set to take place this week.
U.S. futures are mixed, with the Dow Jones set to open slightly higher as we approach the opening bell.
Current Outlook
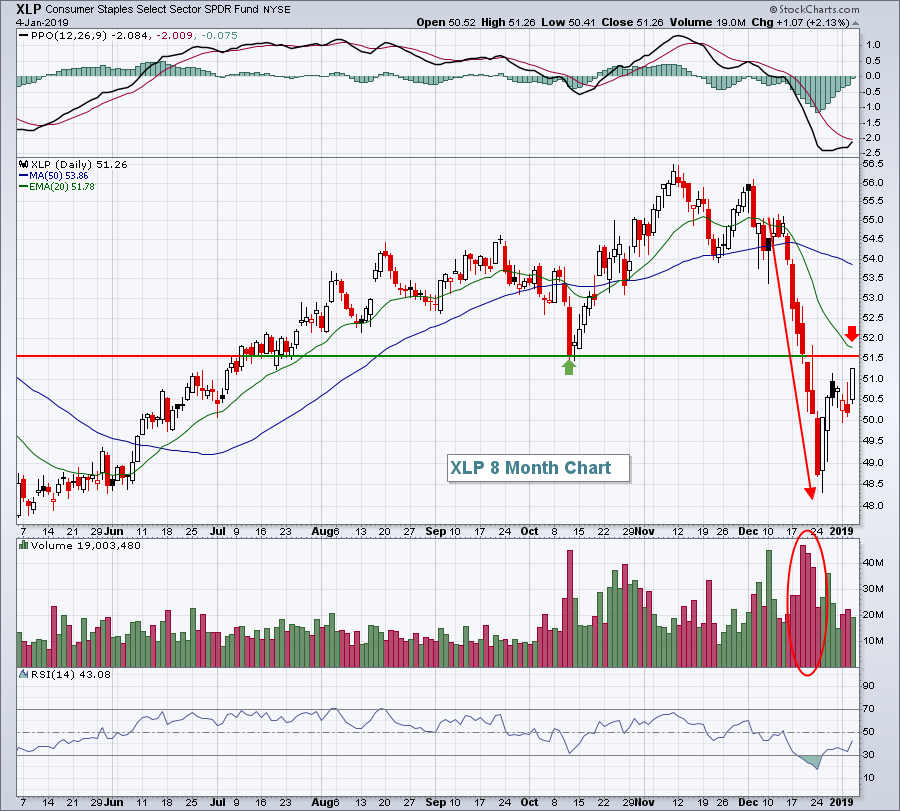
Even our defensive sectors finally caved in during the December selloff and are now suggesting lower prices could lie ahead. Consumer staples (XLP) suffered through a brutal seven trading day period from December 14th through 24th, losing price support established on October 11th. That price level now serves as overhead resistance and should be respected near-term:
 If the XLP can clear the price resistance, then the declining 20 day EMA, currently at 51.78, becomes problematic. Note the heavier December volume to accompany that price breakdown. While it's not impossible that we simply push right back up through resistance, technical analysis is based upon probabilities. I'd say the better chance is that the XLP rolls over and heads back towards its recent low.
Sector/Industry Watch
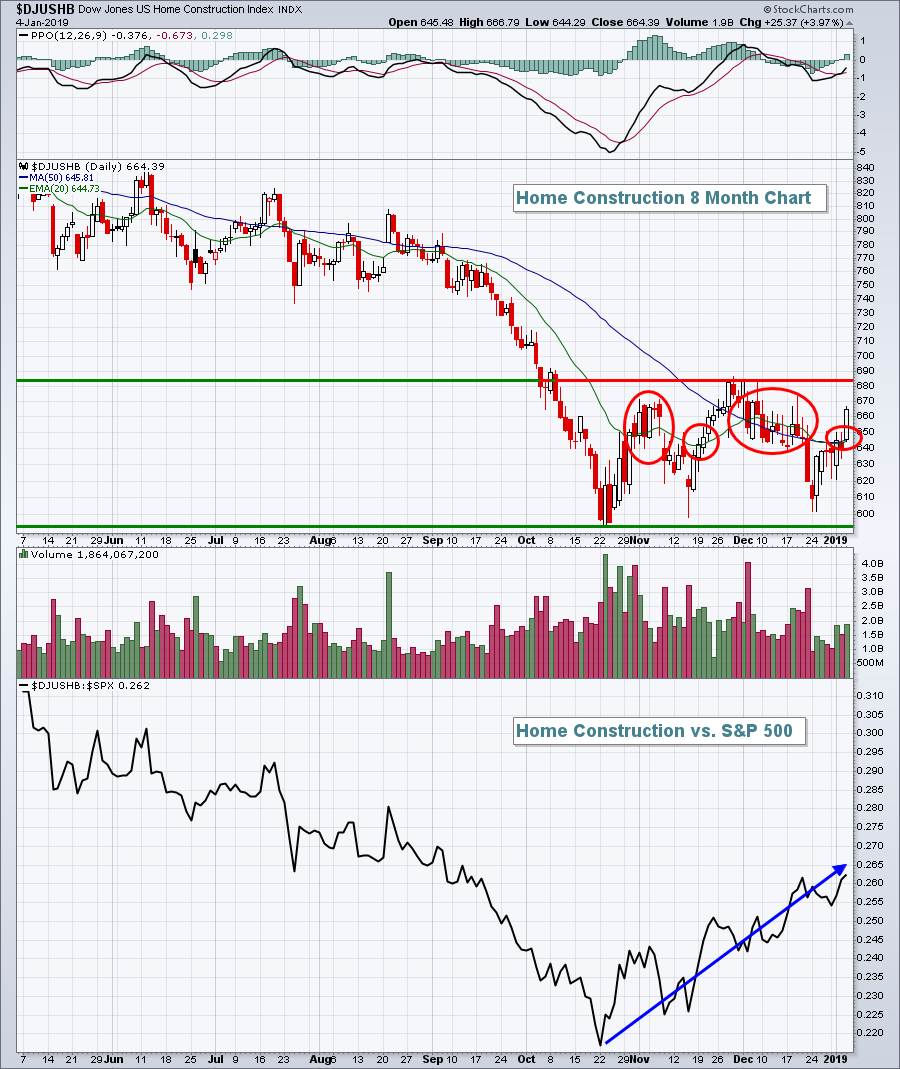
Home construction ($DJUSHB, +3.97%) moved back above both of its key moving averages on Friday, but there's still much work to do on its chart technically. In fact, during its recent period of consolidation that began off its late-October low, we've seen these moving averages pierced multiple times. Keep in mind that moving averages provide excellent support/resistance during periods of trending prices. Throughout consolidation, however, using moving averages can be futile. Here's the latest on the chart:
 There are two key takeaways from the above chart. First, it's easy to see from the red circles how difficult it is to rely on moving averages during consolidation. We move above the moving averages with little difficulty, then come right back down beneath them. It's like they're not even there. Second, money has been rotating into home construction since late-October. It hasn't shown up in terms of uptrending prices, but when you consider how poorly the S&P 500 performed in Q4, I think it's definitely obvious on the $DJUSHB:$SPX relative chart.
Monday Setups
The S&P 500 has bounced off the late-December low and reached its first critical price resistance area. If you recall, the February 2018 intraday low was 2532, which marked the beginning of price support established during 2018. The breakdown in December now suggests that 2532 will be our first level of resistance, followed by 2581 (2018 closing price support), then the declining 20 week EMA, currently at 2676. In my opinion, these are the three critical levels to watch as we move forward into 2019.
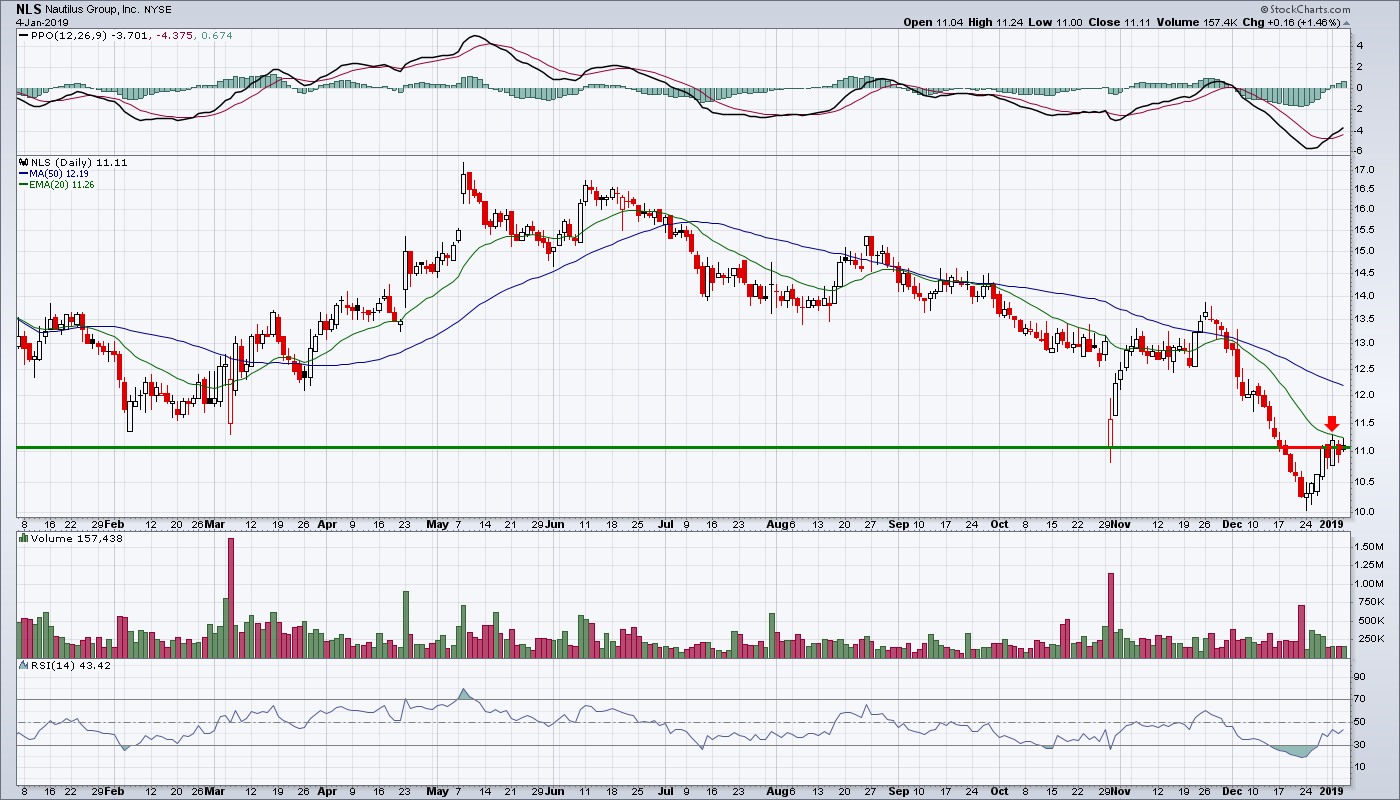
Since we're testing initial resistance, I'd look for shorting opportunities, although I'd keep position sizes small and stops tight as further upside is certainly possible. Nautilus (NLS) is a company that was punished in late-October after delivering quarterly revenues and EPS that fell short of Wall Street expectations. The gap down was significant and was followed by a rally into late-November. Then we saw more than a 30% selloff to the late-December low before the recent rally. NLS is now testing overhead resistance at its declining 20 day EMA, a high reward to risk shorting level:
 I'd expect to see a short-term drop to retest the recent price low near 10.00, while watching to make sure NLS doesn't clear its 20 day EMA on a closing basis. An intraday stop near 11.40-11.50 should be considered as well.
I provided three setups this week. To view all recent Setups, CLICK HERE.
Historical Tendencies
I highlighted the DJUSHB chart above in the Sector/Industry Watch section. The group has bullish historical tendencies from November through January. While we haven't seen absolute price improvement during this period currently, the group has definitely outperformed on a relative basis as reflected on the chart earlier. Here are the average monthly returns for the DJUSHB over the past two decades:
November: +3.1%
December: +4.5%
January: +3.1%
It's a little counter-intuitive to see home construction perform so well during winter months, but the stock market looks ahead, so this is likely the result of the stock market anticipating the strong spring season for homebuilders.
Key Earnings Reports
None
Key Economic Reports
November factory orders to be released at 10:00am EST: +0.4% (estimate)
December ISM non-manufacturing index to be released at 10:00am EST: 58.4 (estimate)
Happy trading!
Tom
