Market Recap for Thursday, November 8, 2018
Well, another Fed day has come and gone. The FOMC ended its two day meeting and left rates unchanged, as expected. It promised, however, further gradual increases. If you recall, the spike in the 10 year treasury yield ($TNX) to 3.25%, a 7 year high, accompanied the October dive in equity prices. Many market pundits were blaming higher interest rates for the selling in equities. Yet, the latest rise in U.S. stocks has been accompanied with a similar rise in the TNX to 3.23%. Still, the Fed's discussion of further rate hikes will be pointed to by many as a problem for stocks. I'm not in that camp. Instead, I'm in the camp that's simply watching the price action and sector rotation. More on that in the Current Outlook section below.
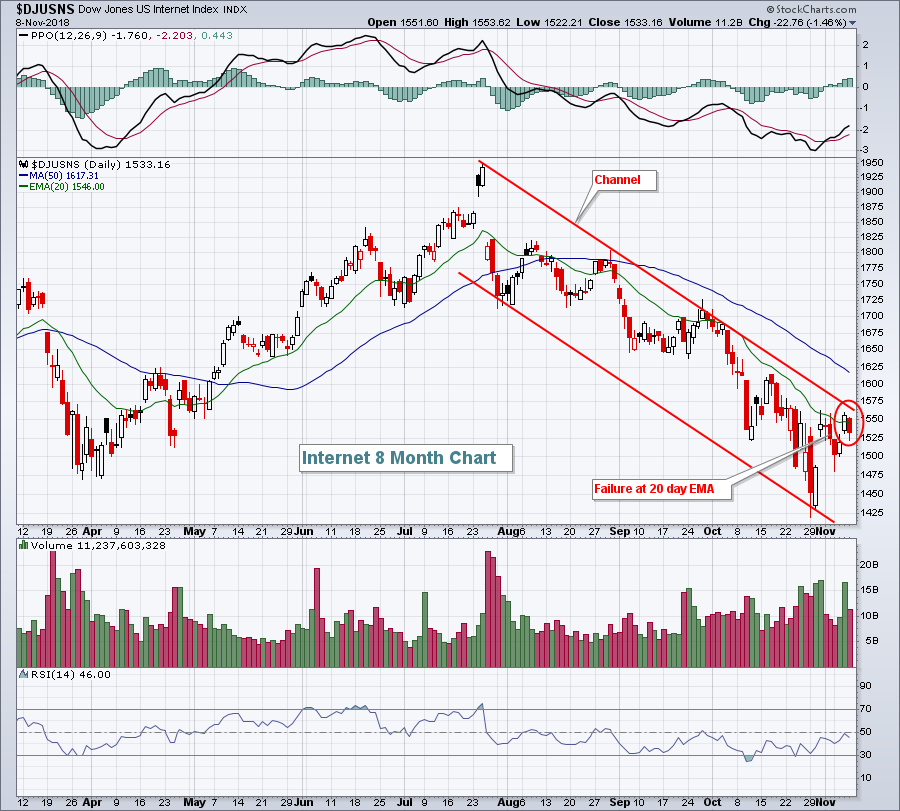
On Wednesday, U.S. indices ended in bifurcated fashion with the Dow Jones clinging to a small 11 point gain while the other major indices finished in negative territory. Sectors were evenly split between gains and losses, but the clear losers on the day were energy (XLE, -2.17%) and communication services (XLC, -0.94%). The latter was impacted by the continuing absolute and relative weakness in internet stocks ($DJUSNS, -1.46%). After closing above its declining 20 day EMA on Wednesday, the DJUSNS fell back beneath it on Thursday as Spotify (SPOT, -6.02%), Take-Two Interactive Software (TTWO, -5.30%), Netflix (NFLX, -2.93%) and Facebook (FB, -2.42%) all suffered significant losses. Here's the group's failure:
 That's a well-defined downtrend channel where the failure yesterday took place. Internet stocks may in time right the ship, but currently it's a group I'd avoid.
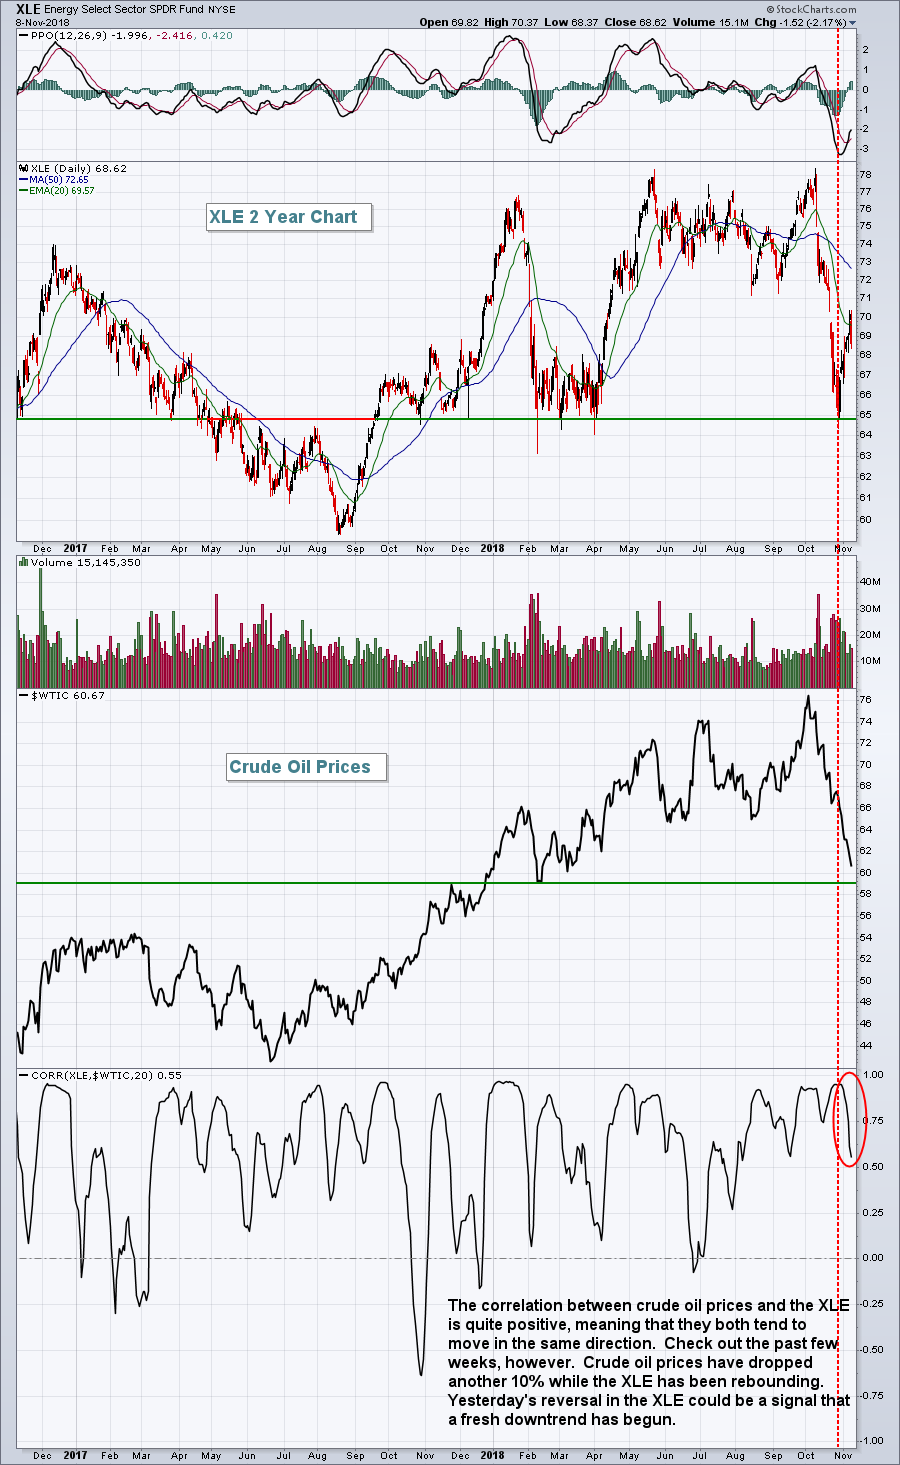
Energy, meanwhile, has been ignoring the latest precipitous drop in crude oil prices ($WTIC). Check this out:
 Watch to see if crude oil finds a bid near the $59 level. That's the February 2018 low. If that doesn't hold, the XLE could be in big trouble as we move forward.
Pre-Market Action
The U.S. Dollar Index ($USD) is on the rise again and nearing a 16 month high, which is putting additional pressure on commodities. Crude oil prices ($WTIC) are down another buck this morning to under $60 per barrel for the first time since the February 2018 low. The $59 support level is very important in my view. Look for another potentially rough day in the energy space given the tumbling crude prices.
Gold ($GOLD) is also having a tough morning, down $12 per ounce to $1213. The $1180-$1240 trading range remains in play. GOLD will have a difficult time breaking out to the upside if the USD continues rising.
Most Asian markets suffered losses of 1-2% overnight and European indices are lower as well. A surprisingly hot PPI and Core PPI report this morning may have traders on edge as well. Dow Jones futures are currently lower by 146 points with a little more than 30 minutes left to the opening bell.
Current Outlook
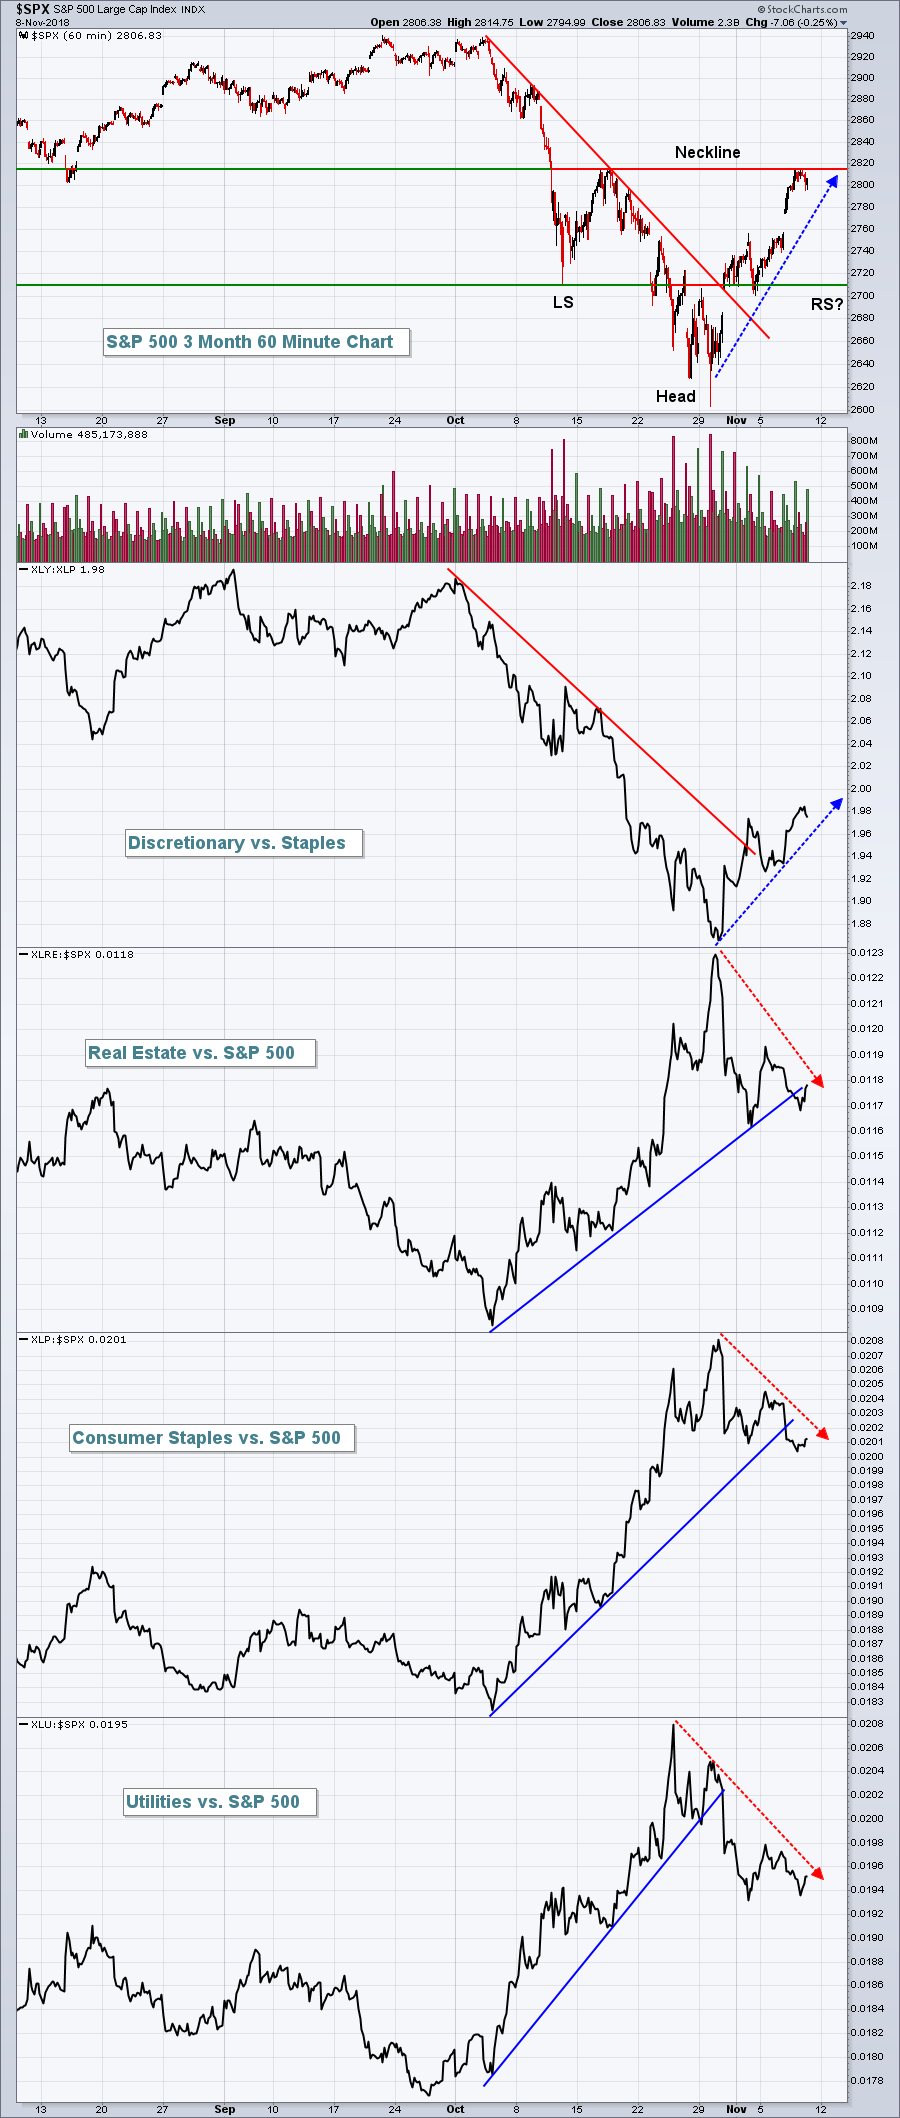
I mentioned during MarketWatchers LIVE yesterday that the bears were on the defensive as the S&P 500 had climbed to a very significant price resistance level and had done so just as short-term price relative breakdowns were occurring in a few key defensive areas. If the S&P 500 could clear the 2817 area with money rotating to aggressive areas of the market, in my opinion, a lot more technical buyers would appear. Fortunately for the bears, they provided resistance and won the short-term battle yesterday afternoon. Here's a 3 month 60 minute chart that's worth keeping an eye on:
 The intraday price to watch on the S&P 500 is 2816.94 and the closing price is 2813.89. Keeping an eye on the above sector relative charts would be a good idea as well. If the S&P 500 pulls back further, but we don't really see much outperformance by defensive sectors, that could be a very important signal that the weakness won't last.
Sector/Industry Watch
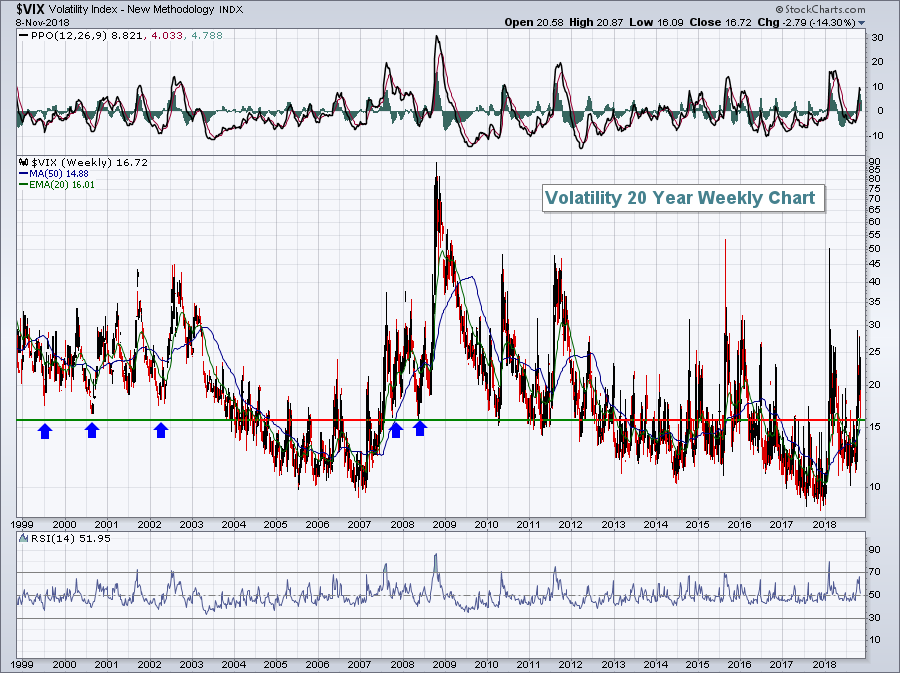
The following long-term chart of the Volatility Index ($VIX) will simply serve as a reminder that the VIX never closed below 16 during each of the prior two bear markets. So for those in the bear market camp, I'd see how the VIX reacts from here:
 It would also be very unusual to begin a bear market in Q4. It has happened before as the 2007 top occurred on October 10th, but Q4 has historically been the most bullish quarter for U.S. equities, dating back to 1950.
Historical Tendencies
The Dow Jones U.S. Commercial Vehicles & Trucks Index ($DJUSHR) typically loves the month of November, rising 18 of the last 20 Novembers and producing average November returns of 5.5%. December is not too shabby either, with average December gains of 3.2%. However, I'd be careful if the group drops below 1820 on a closing basis.
Key Earnings Reports
None
Key Economic Reports
October PPI released at 8:30am EST: +0.6% (actual) vs. +0.2% (estimate)
October Core PPI released at 8:30am EST: +0.5% (actual) vs. +0.2% (estimate)
Happy trading!
Tom
