Market Recap for Tuesday, November 6, 2018
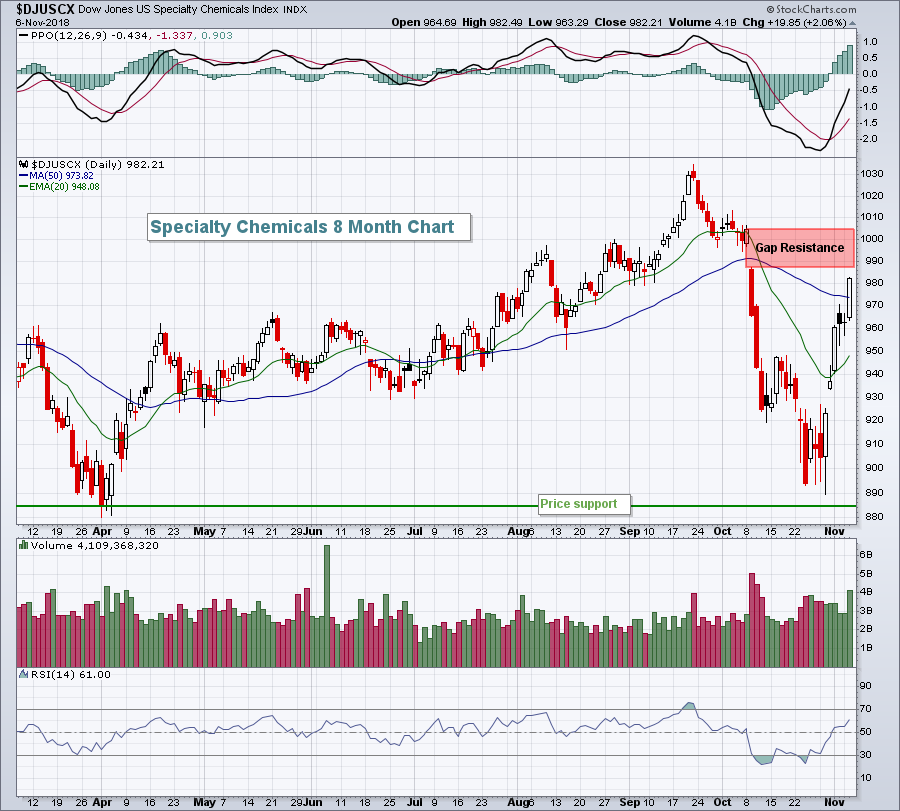
All eleven sectors rose on Tuesday with materials (XLB, +1.64%) leading as the U.S. Dollar Index ($USD) closed at its lowest level in nearly two weeks. All of our major indices had similar gains, from 0.55% to 0.68%, as U.S. voters headed to the polling booths. Mylan (MYL, +16.02%), Symantec (SYMC, +12.50%) and Mosaic (MOS, +10.71%) were the three top S&P 500 performers, all surging after releasing their latest quarterly earnings reports. MOS led a very strong specialty chemicals group ($DJUSCX, +2.06%) that has now rallied approximately 10% off its lows from one week ago:
 Watch for a possible reversing candle near gap resistance. The heavy selling began with the October 9th gap lower so that's a key level to watch on this rebound. I would expect to see the rising 20 day EMA provide solid support on any short-term weakness.
Travel & tourism ($DJUSTT, +3.33%) stocks were lifted by a strong outlook from Bookings Holdings (BKNG, +4.19%), despite the company missing EPS estimates ($37.78 vs $38.37). The stock market looks forward and BKNG raised both its revenue and EPS guidance for Q4.
Pre-Market Action
The U.S. Dollar ($USD) is lower this morning with the 10 year treasury yield ($TNX) down slightly to 3.20%. Asian markets were somewhat quiet and mixed overnight, while European markets are producing solid gains this morning. The German DAX ($DAX) is up nearly 1% on the session.
U.S. futures are strong this morning with Dow Jones futures higher by 153 points. NASDAQ futures are up approximately 1%.
Current Outlook
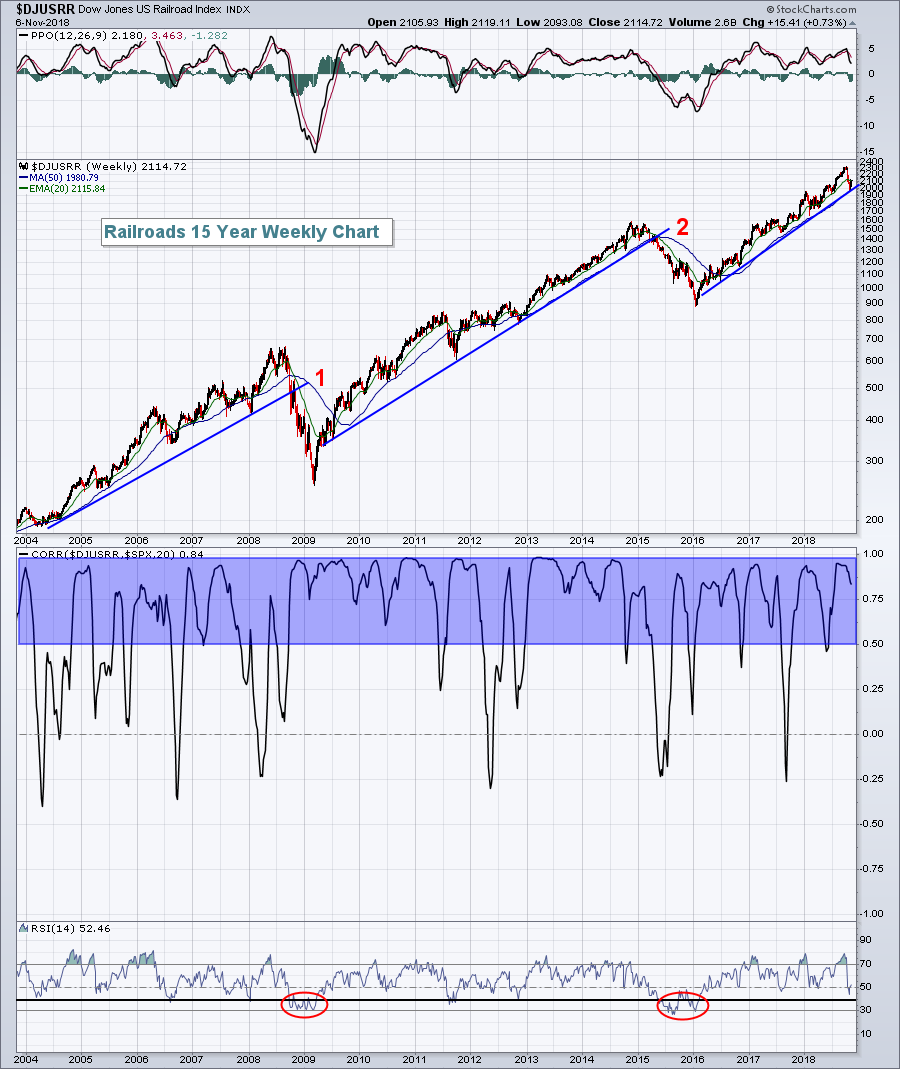
Railroads ($DJUSRR) have struggled quite a bit over the past month, dropping nearly 8%. But their overall leadership remains clear. The DJUSRR has easily been the best performing industry group within the industrials sector over the past six months (+13.07%), nearly doubling the performance of its closest competitor - aerospace ($DJUSAS, +7.11%). I always keep a close eye on DJUSRR performance as it's a great leading indicator of our economy. There's a very tight positive correlation between the direction of railroad stocks and the direction of the S&P 500. Check this out:
 First, the blue shaded area represents positive correlation from 0.50 to 1.00. This area suggests extremely tight positive correlation so I think it's quite clear that following DJUSRR performance can be a great tool to monitor likely S&P 500 performance as well. The only two real difficult times for the U.S. stock market over the past 15 years were both accompanied by warning signs from railroads. These signals didn't occur at the beginning of the S&P 500 decline, but certainly would have helped us avoid the majority of the S&P 500 struggles. Note points 1 and 2 in red above. Long-term uptrends in DJUSRR performance occurred and weekly RSIs dipped below 40. When that occurs, the S&P 500 is likely to do the same and you should take necessary precautions. But check out where we are now. The weekly RSI dipped into the 40s, but turned back up prior to breaking down. And the long-term uptrend line, in place since early-2016, has not been broken. Railroads have yet to provide us any kind of warning. A break below the early summer lows near 1950 would begin to flash a warning signal.
Sector/Industry Watch
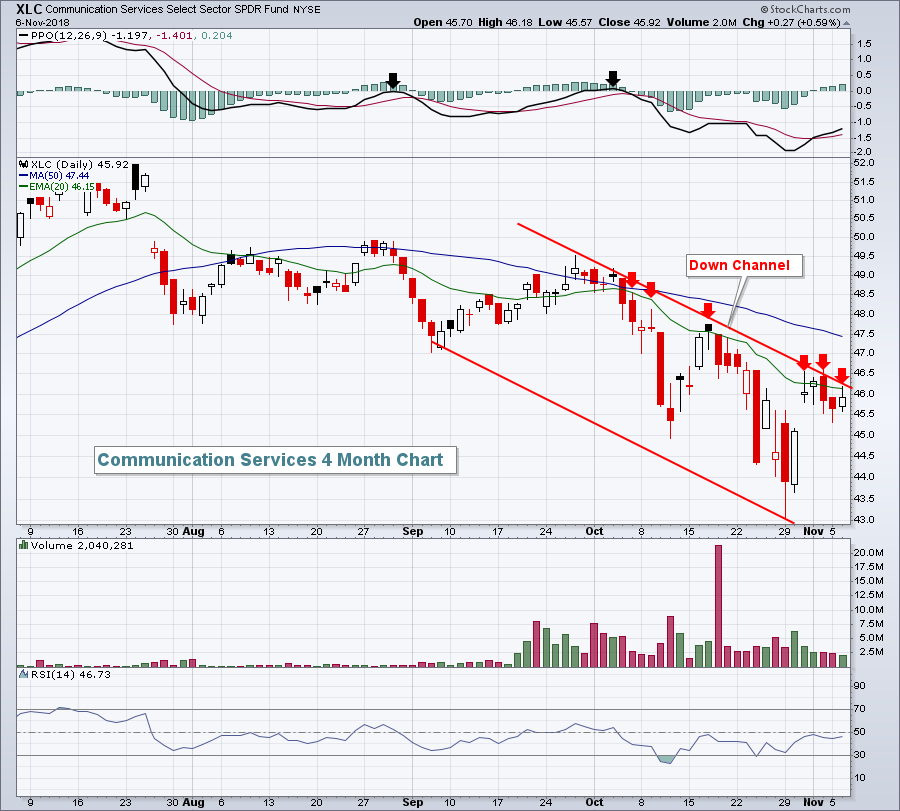
Key aggressive sectors like technology (XLK), industrials (XLI) and communication services (XLC) have yet to break back above 20 day EMAs, a necessary first step to repairing recent technical damage and resuming their prior uptrends. That latter group, the XLC, has failed on multiple occasions at its 20 day EMA and is in the midst of a serious short-term down channel. We can say everything is ok with the market and that this is only a minor blip or correction in an ongoing decade-long bull market. But we need this aggressive sector to change its current direction:
 From a big picture perspective, the XLC needs to see its short-term momentum improve to the point where its PPO can climb back above centerline resistance. The black arrows above highlight two failures to do just that, in August and October. But before we're able to get that far, we'll need to break out of this down channel. Several red arrows highlight 20 day EMA failures and these short-term tops have established the top of the channel. A close above 46.50 would begin to reverse the bearish action in the XLC.
Historical Tendencies
Ten days or so ago, I indicated that we were ending the most bearish week of the year (October 22 through 27) and beginning the most bullish period of the year (October 28 through November 6). Well, those bullish seasonal tailwinds came to an end at Tuesday's close. The S&P 500 added nearly 100 points during this bullish historical period and even managed to close slightly above its 20 day EMA, currently at 2749. The SPX ended the day at 2755. There's still a bit of overhead work to do as gap resistance resides at 2755 - exactly where we closed yesterday. If we can negotiate this level of resistance, 2810 would be next.
Key Earnings Reports
(actual vs. estimate):
DISH: .82 vs .67
FOXA: .52 vs .53
HUM: 4.58 vs 4.29
KORS: 1.27 vs 1.09
ROK: 2.11 vs 2.03
SO: 1.14 vs 1.07
SRE: 1.23 vs 1.13
(reports after close, estimate provided):
ALB: 1.25
ANSS: 1.04
CTRP: .33
DVA: .89
ET: .59
EVRG: 1.26
HOLX: .59
IAC: 1.04
KDP: .27
LBTYA: .27
MCHP: 1.74
MFC: .50
MNST: .46
MRO: .20
PRU: 3.14
QCOM: .83
SLF: .89
SQ: .11
TTWO: .91
WYNN: 1.77
Key Economic Reports
None
Happy trading!
Tom
