Special Note
I will be speaking to the Charlotte Chapter of the American Association of Individual Investors (AAII) this Saturday, October 13th at 10:00am EST. I plan to discuss how to evaluate the sustainability of a bull market, relative strength and gap trading strategies. The first meeting is FREE to non-members, so if you're in the Charlotte area, please stop by and say hello! For more information, CLICK HERE.
Market Recap for Wednesday, October 10, 2018
It was simply one of those days where it didn't matter what you owned. It likely went down. All of our sectors finished lower, including technology (XLK, -4.85%), communication services (XLC, -3.95%) and consumer discretionary (XLY, -3.37%), which were hit the hardest. The NASDAQ fell more than 4%, while both the Dow Jones and S&P 500 lost more than 3%. The small cap Russell 2000 was the "best" performer, dropping just under 3%. Every component of the Dow Jones fell on the day, including the likes of Nike, Inc. (NKE, -6.79%) and Microsoft, Inc. (MSFT, -5.29%). Only about 20 stocks on the S&P 500 gained ground on the session. Simply put, it was a bloodbath.
And here's the worst news:
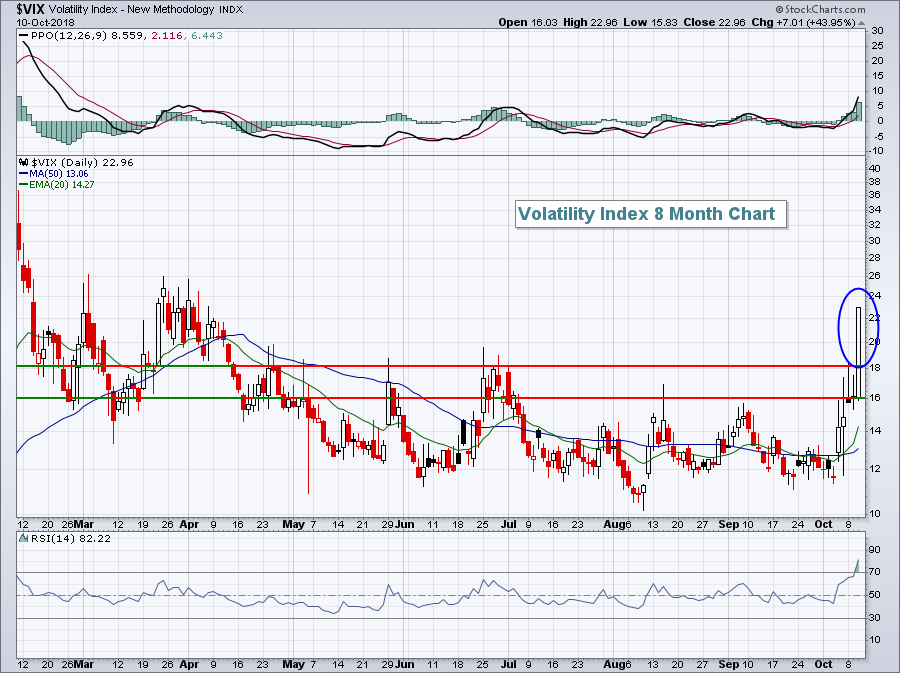
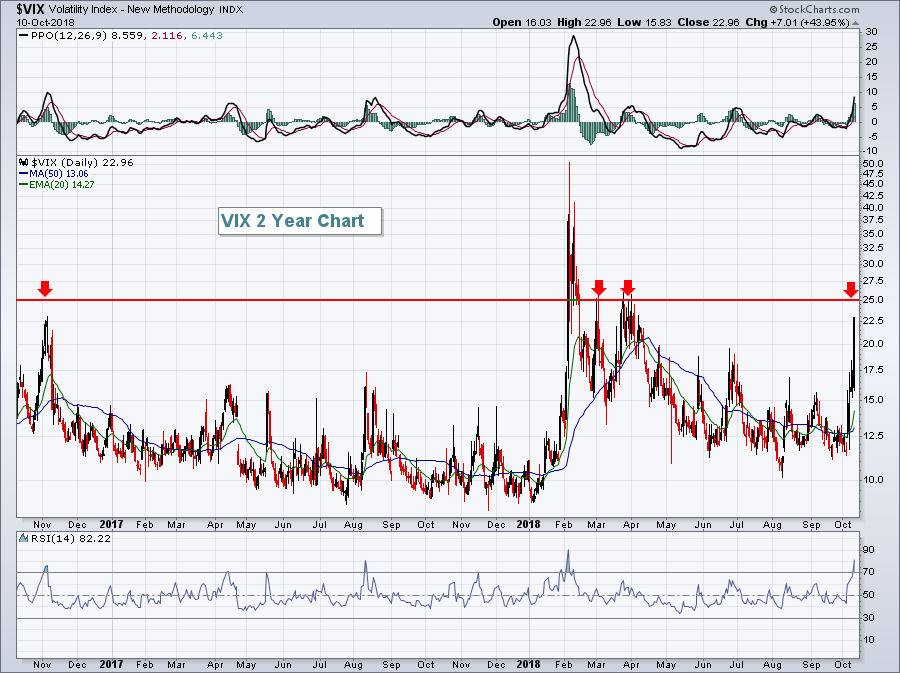
 Fear ran wild into the close yesterday, as evidenced by the VIX blowing past 6 month resistance in the 16-18 area. Stocks were in a freefall into the Wednesday's close and the VIX closed at its highest level since late March. Now the 26 level seen then will be the next area to watch closely. A close above 26 would most likely result in further panicked selling and we all should know by now how quickly stocks can fall in this environment.
Software ($DJUSSW, -5.20%) and financial administration ($DJUSFA, -5.29%) were two industry groups that suffered losses larger than nearly all other industries and they both continue to lose their market leadership status.
Pre-Market Action
The global markets have turned quite defensive. Asian markets tumbled overnight, European markets are adding to their short-term woes this morning and U.S. futures are pointing to a lower open as well. Dow Jones futures are down 57 points as we approach the opening bell, well off their earlier lows.
Gold ($GOLD) is benefiting from the flight to safety mentality and a weaker dollar ($USD).
Current Outlook
The 43% rise in the Volatility Index ($VIX) on Wednesday isn't unprecedented, but it's not exactly a normal occurrence either. The last time we saw the VIX spike similar to yesterday was on Friday, February 2, 2018 when the VIX jumped 28.5%. The next trading day, Monday, February 5, 2018, the VIX soared 115% and the Dow Jones lost 1175 points. I'm not saying we'll see that today, but I do believe we're in for fireworks and where the market ends I have no idea. A highly volatile market is nearly impossible to predict. I definitely expect more downside action, but high VIX readings mark significant bottoms. A VIX at the 23 level and rising has the ability to leave major destruction in its path very similar to a hurricane. The wind strength of hurricanes is based on the Saffir-Simpson scale from Category 1 to Category 5. As an analogy, I'd say the VIX in the 16-20 area represents a Category 1 correction. Currently, we're in a Category 2 market hurricane with a VIX in the 20-25 range. Further strengthening is definitely a possibility and a VIX close above 25 would represent the next step (Category 3) in this panic-driven market:
 I hesitate to post any charts on our major indices or sectors highlighting key support levels because once the S&P 500 lost support yesterday and the VIX surged, market action became about fear and panic and had little to do with support levels. As I've said many times in the past, market makers (who are responsible for providing liquidity during periods of supply and demand imbalances) go "on vacation" during volatile periods like this. The heavy volume panic cannot be contained and they don't even try. That's why the market retreats so much faster than it rises.
Sector/Industry Watch
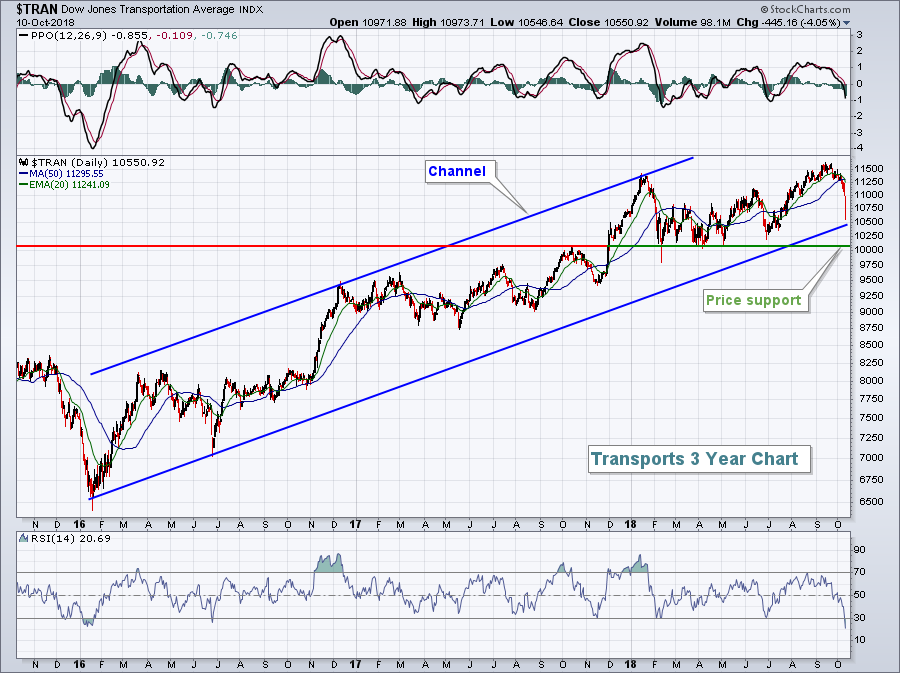
Ok, I said I wouldn't post charts of support, but I can't resist posting this one:
 Transports ($TRAN) are a critical area of the market and they finally succumbed to the selling pressure yesterday afternoon. I can make a bullish argument down to channel support and price support at 10500 and 10000, respectively. Beyond that, things get very dicey. So......IF the market reverses today, tomorrow, whenever, does the TRAN hold onto support in this zone? If so, the TRAN would remain on longer-term buy signal. If not, well the odds would begin to stack up against the bulls.
Historical Tendencies
While you wouldn't know it by the action thus far this month, October ranks as the best performing calendar month on the S&P 500 over the past two decades.
Key Earnings Reports
(actual vs. estimate):
CBSH: 1.03 vs .97
DAL: 1.80 vs 1.74
WBA: 1.48 vs 1.44
Key Economic Reports
September CPI released at 8:30am EST: +0.1% (actual) vs. +0.2% (estimate)
September Core CPI released at 8:30am EST: +0.1% (actual) vs. +0.2% (estimate)
Initial jobless claims released at 8:30am EST: 214,000 (actual) vs. 207,000 (estimate)
Happy trading!
Tom
