Special Note
I will be speaking to the Charlotte Chapter of the American Association of Individual Investors (AAII) tomorrow Saturday, October 13th at 10:00am EST. I plan to discuss how to evaluate the sustainability of a bull market, relative strength and gap trading strategies. The first meeting is FREE to non-members, so if you're in the Charlotte area, please stop by and say hello! For more information, CLICK HERE.
Market Recap for Thursday, October 11, 2018
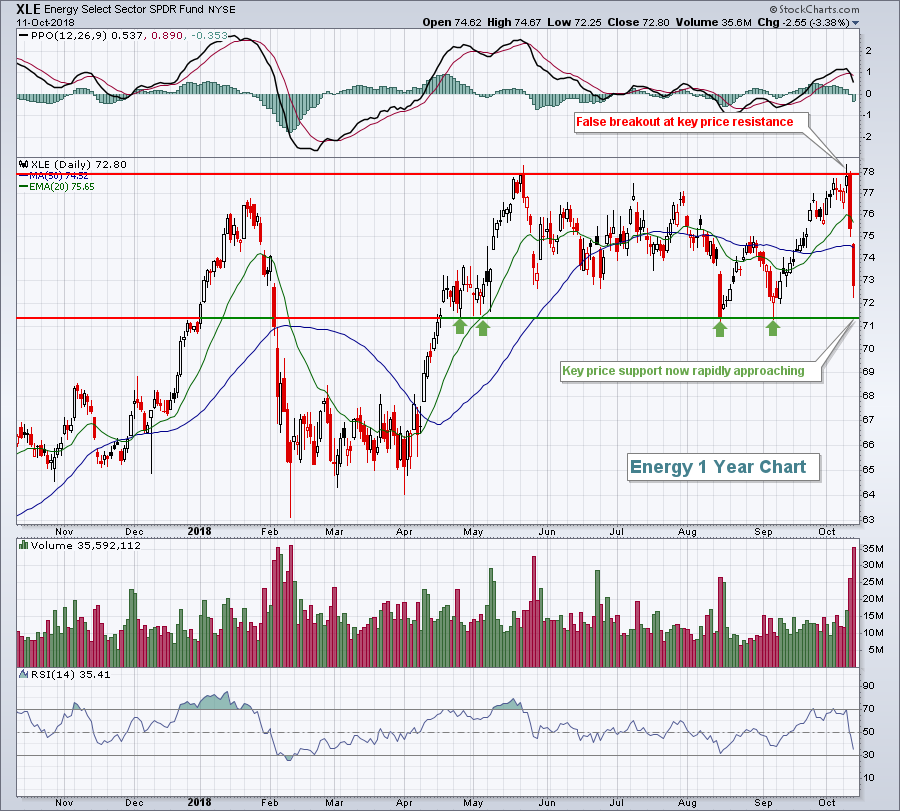
It was another difficult day for Wall Street, with most of our major indices falling close to 2%. The cast of characters did change, however, as the NASDAQ held up best, "only" falling 1.25%. The sectors that had previously performed the worst during this downtrend - communication services (XLC, -0.85%), technology (XLK, -1.27%) and consumer discretionary (XLY, -1.76%) - actually outperformed on a relative basis yesterday, despite still sinking to new recent absolute price lows. The new leaders to the downside included energy (XLE, -3.38%), financials (XLF, -2.98%) and real estate (XLRE, -2.93%). The latter saw weakness in all nine of its industry groups. Real estate services ($DJUSES) is featured in both the Sector/Industry Watch and Historical Tendencies sections below.
Energy has been the biggest disappointment the past two days. The XLE was in breakout mode intraday on Wednesday, but failed to close the deal by 4pm EST. That failure likely encouraged more selling yesterday and selling is exactly what we saw:
 The failure to break out and lead the market was a disappointment for the bulls that were looking for other areas to lead while technology and consumer discretionary corrected. But when failures occur in all sectors, technical buyers disappear and fear accelerates. That's what we're dealing with now.
Pre-Market Action
Mostly better-than-expected EPS results came from four large banks, including JP Morgan Chase & Co (JPM). Pre-market reaction is solid for the most part, but let's see what happens after the opening bell. Currently, Wall Street is poised for a rebound at the open with Dow Jones futures higher by 214 points. But as we've seen of late, the second half of the session will be the most important half. Let's see how we close today.
Global markets are seeing positive action, helping to lead U.S. futures higher.
Current Outlook
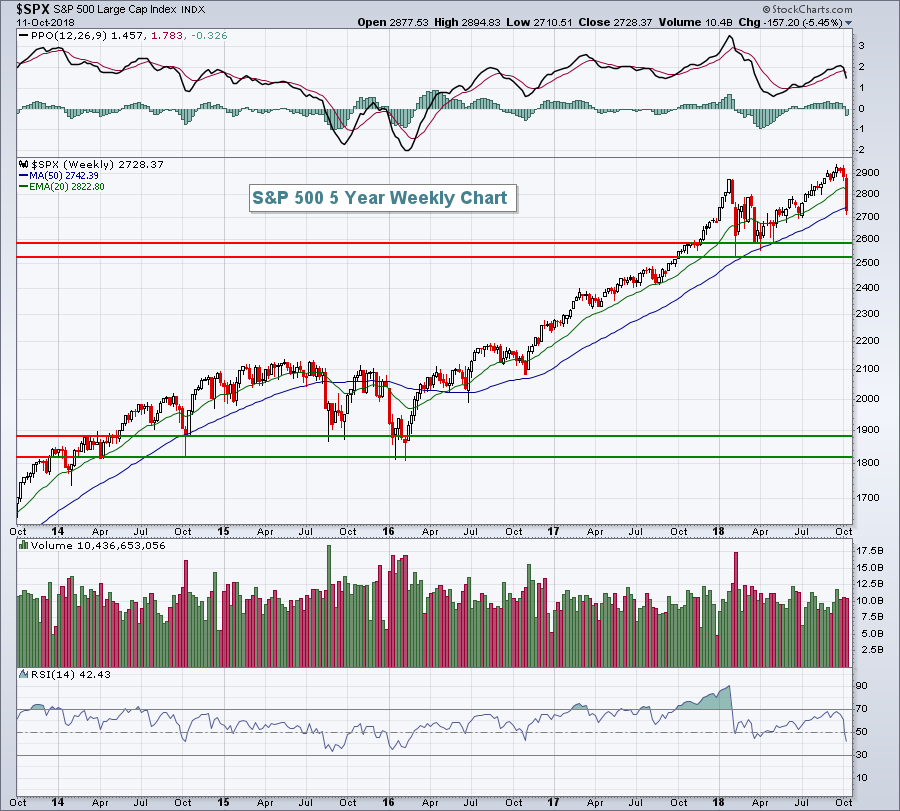
After such heavy selling the past couple weeks, it's time to put a little longer-term perspective on this decline. Yes, the bears are completely in control of the short-term action and a Volatility Index ($VIX) reading of 24.98 (28.84 was the intraday high) underscores that point. So the battle is being lost if you're a bull. But the war isn't over as bigger battles have yet to be fought. Our current situation is beginning to look like 2015 where the S&P 500 set a high, pulled back, then moved to new highs - only to fall back and test that prior support on multiple occasions. Take a look:
 If this turns out to be a repeat of the harrowing end of 2015 and beginning of 2016, then it's quite possible we'll see a test of that January 2018 low with a VIX that soars back into the 40-50 range. Because I remain bullish, that would be my "worst case" scenario as I do not believe we're in the beginning stages of a bear market. During long-term uptrends, short-term corrections many times result in RSI readings at or near 40. From the chart above, you can see that our current weekly RSI reading is at 42. We could reverse and move right back towards recent highs at any time. From a short-term perspective, I'd really like to see a day of despair with the Dow Jones moving down by 1000 points or more, then rallying back strongly in the afternoon - all of that accompanied by a VIX reading that shoots higher, well into the 30s or even 40s before reversing. That would likely mark a very significant bottom. Short of that type of market behavior, it's much more difficult to call an exact bottom.
Sector/Industry Watch
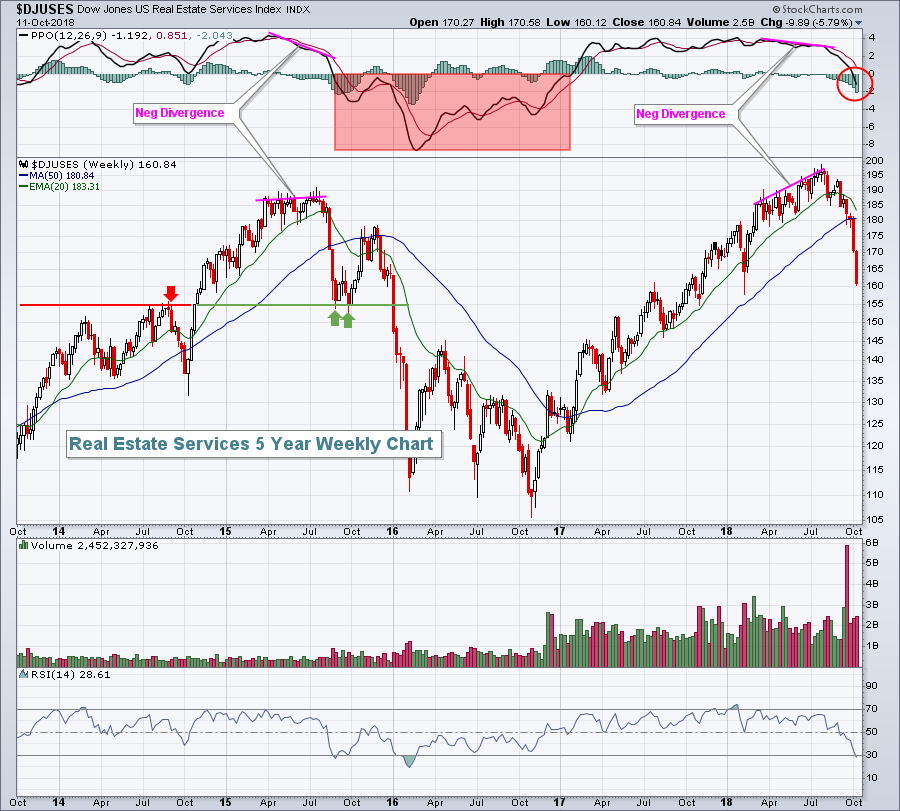
 It's not a pretty picture, is it? The Dow Jones U.S. Real Estate Services Index ($DJUSES) has broken beneath its 50 week SMA and its weekly PPO has turned negative. It feels very reminiscent of the decline that began in Q3 2015. Both began with weekly negative divergences in place, indicative of slowing momentum. Then, once key moving averages were lost, the selling accelerated. We'll likely see a bounce here, perhaps back to the 180 level, but what it does from there will be critical.
Historical Tendencies
Most industry groups perform well during Q4 as the overall market tends to perform well. The group ($DJUSES) I featured in the Sector/Industry Watch section above, however, has not typically performed well October through December. Many industries earn the majority of their annual gains during Q4. For instance, Commercial Vehicles & Trucks ($DJUSHR) has earned 71% of its annual gains during Q4. The DJUSES, despite a solid track record on an annual basis (+14.3%), has only averaged gaining 3.8% in the fourth quarter.
Key Earnings Reports
(actual vs. estimate)
C: 1.74 vs 1.66
JPM: 2.34 vs 2.24
PNC: 2.82 vs 2.73
WFC: 1.13 vs 1.17
Key Economic Reports
October consumer sentiment to be released at 10:00am EST: 99.5 (estimate)
Happy trading!
Tom
