Market Recap for Monday, October 15, 2018
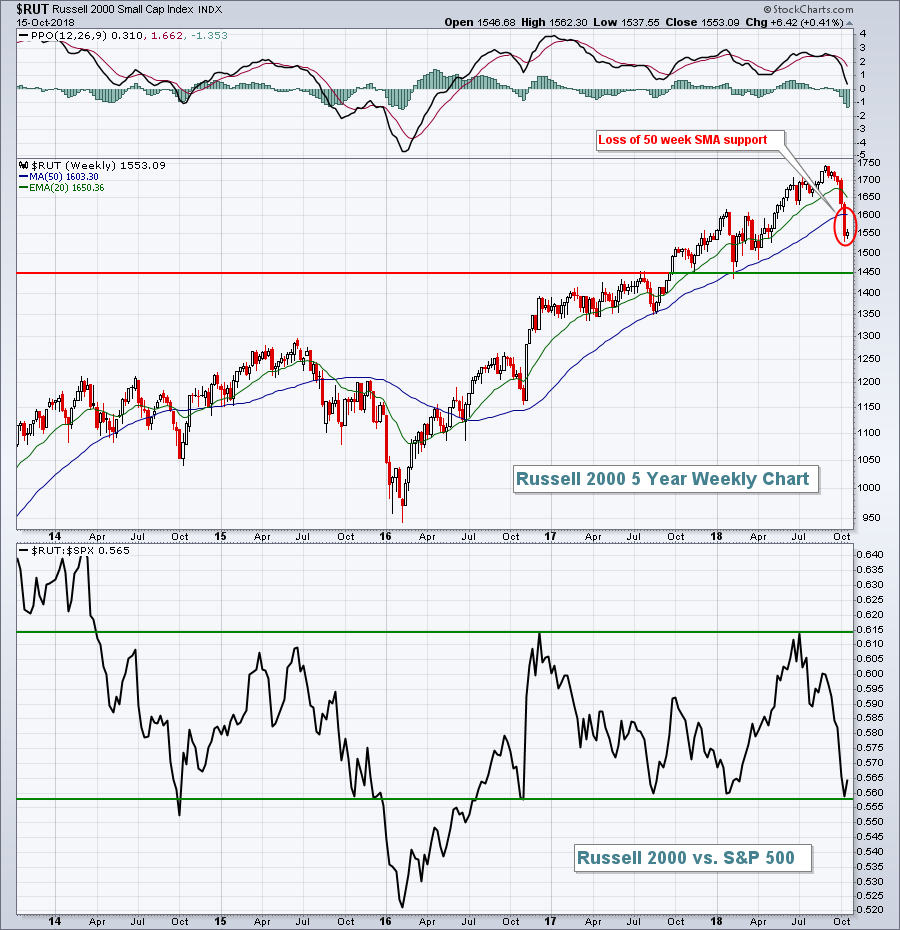
A late afternoon selling binge pushed our major indices into negative territory by the close, with the lone exception being the small cap Russell 2000 ($RUT), which avoided a relative breakdown vs. the benchmark S&P 500. Small caps have been languishing and significantly underperforming large caps since the start of September as you can see from the following chart:
 Despite yesterday's small cap rally, you can see that the RUT has broken beneath its 50 week SMA for the first time since the early-2016 swoon. On a relative basis, however, yesterday's strength helped the RUT avoid a breakdown relative to the S&P 500. That's important as the U.S. Dollar Index ($USD) remains strong and a further advance there would likely result in relative strength in small caps. We'll see.
From a sector perspective, defensive areas were the clear leader on Monday. Real estate (XLRE, +0.62%), consumer staples (XLP, +0.61%) and utilities (XLU, +0.47%) all posted solid gains, while technology (XLK, -1.64%), energy (XLE, -0.84%) and healthcare (XLV, -0.69%) lagged.
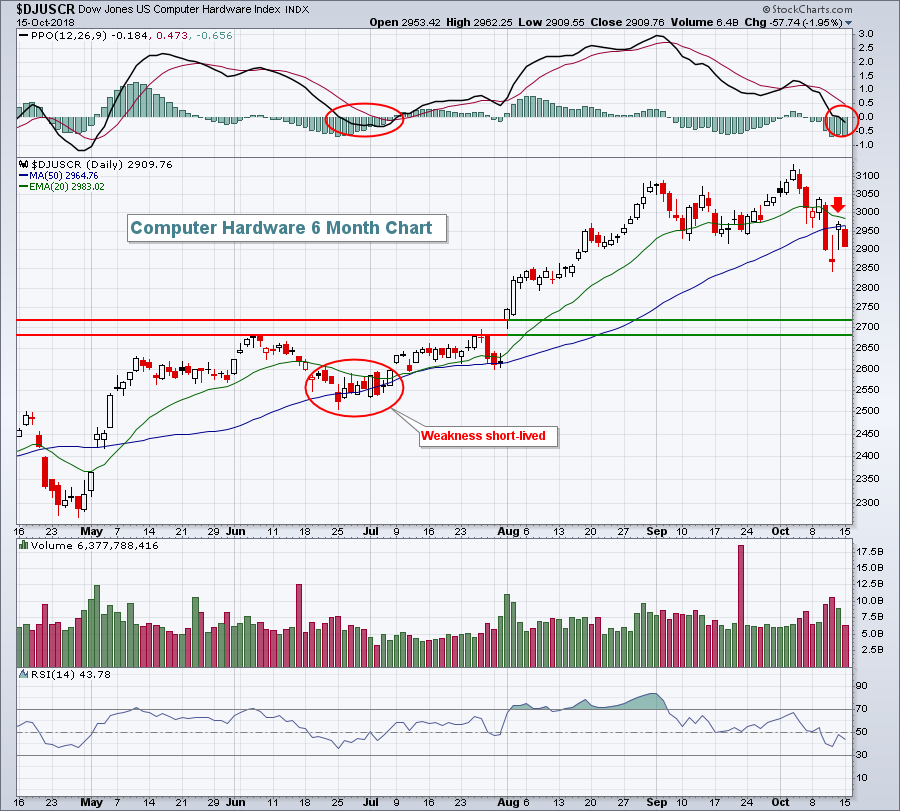
Computer hardware ($DJUSCR) was the worst performing industry group within the technology sector on Monday and its behavior, while fairly solid on a relative basis recently, has turned much more bearish from a short-term perspective:
 The daily PPO has crossed into negative territory and Friday's strength failed to clear its now-declining 20 day EMA. Those are both short-term negatives. The DJUSCR did look weak in late-June for the same reasons, but managed to recover before any further technical deterioration took place. The first step to repair the damage here is to close back above the 20 day EMA.
Pre-Market Action
Strong earnings from several large cap names is helping to provide U.S. futures a lift this morning. Overnight, there was mixed action in Asian markets. But we're seeing mostly strength in Europe this morning. The combination of mostly higher global markets and solid earnings reports are definitely aiding U.S. stocks. Dow Jones futures are higher by 197 points with 30 minutes left to the opening bell.
Current Outlook
We've now seen most of the large money center banks report their latest quarterly earnings as Bank of America (BAC) provided their results on Monday before the opening bell. PNC Financial Services (PNC) was hit very hard and lost price support from earlier 2018 price lows. Others have simply moved lower, although thus far managing to hold prior price lows. JP Morgan Chase (JPM) was the clear relative leader heading into earnings, but even this giant has been hit hard, both before its earnings release.....and after.
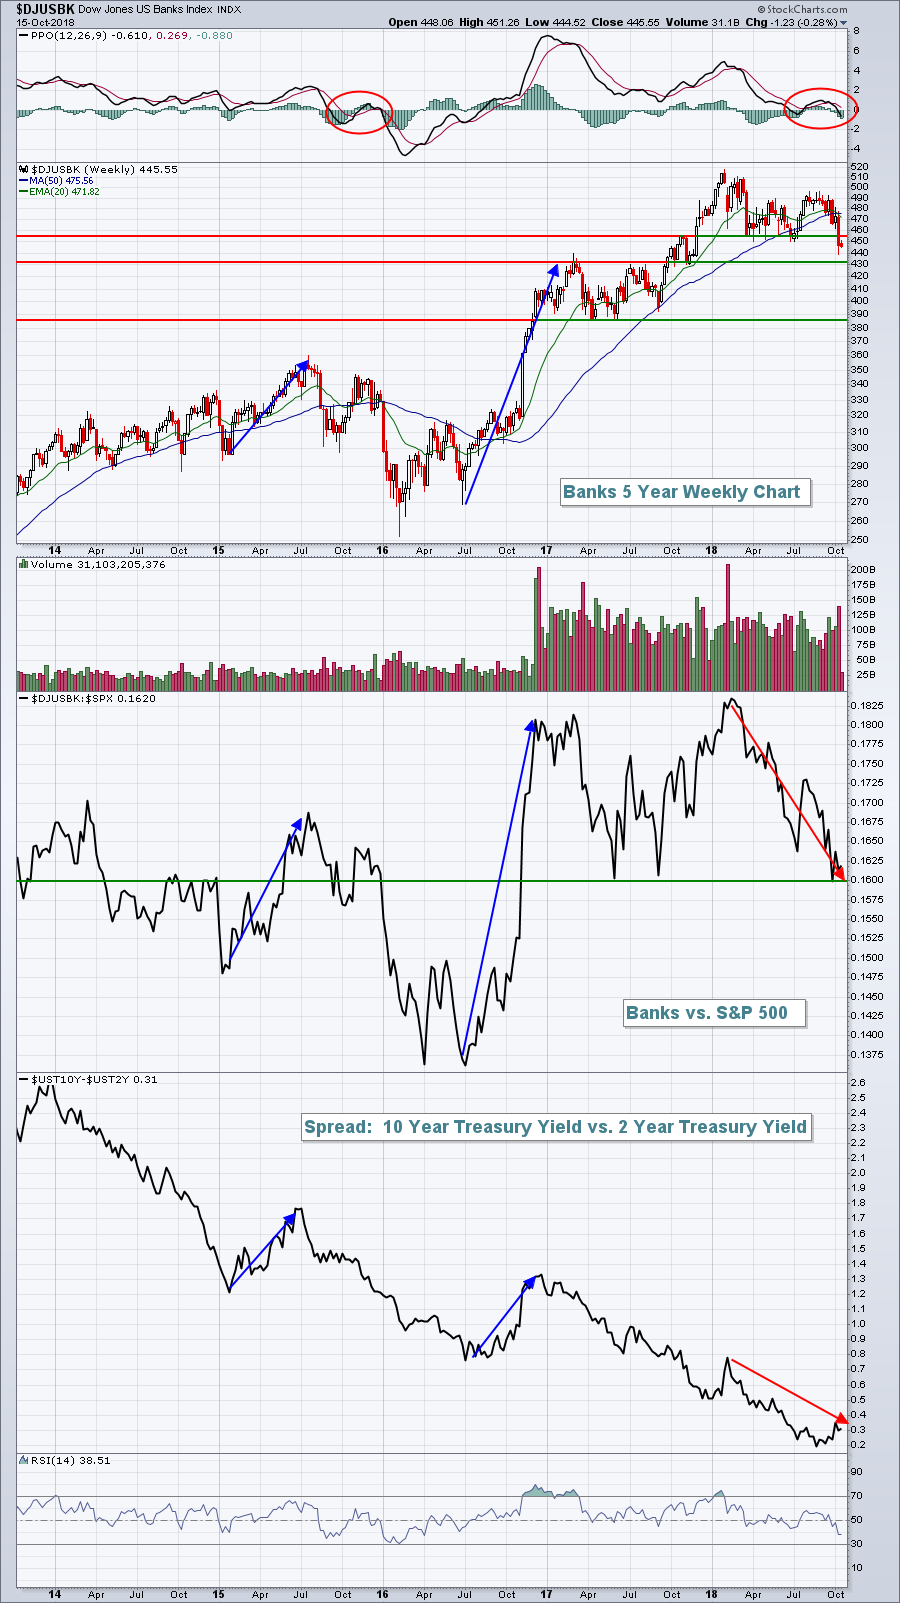
So what's the problem with banks ($DJUSBK)? Well, the narrowing of the yield spread between the 10 year treasury yield ($UST10Y) and the 2 year treasury yield ($UST2Y) is never a bullish development for banks and that spread has been steadily declining for years. So while banks have held their own mostly relative to the S&P 500, this narrowing spread is putting pressure on these banks and restraining their outlooks. Of course, outlooks are what the stock market is most interested in. It's not about what you did in the last quarter or last year, it's much more important about what you're going to do over the next 2-3 quarters. I think this chart will help to explain the problem with banks currently:
 On an absolute basis (top part of chart), banks topped in January just as the yield spread hit a short-term top. And it's this steady decline in spread that is pressuring banks. Check out what happens to banks on both an absolute and relative basis when this yield spread rises (blue directional lines). The group soars and leads the market. So if you're trading bank stocks, more than anything else, you want to see this spread begin to widen. Banks are currently in a very precarious situation as short-term price support near 450 was just lost and the group's relative strength vs. the S&P 500 is hitting support.
Sector/Industry Watch
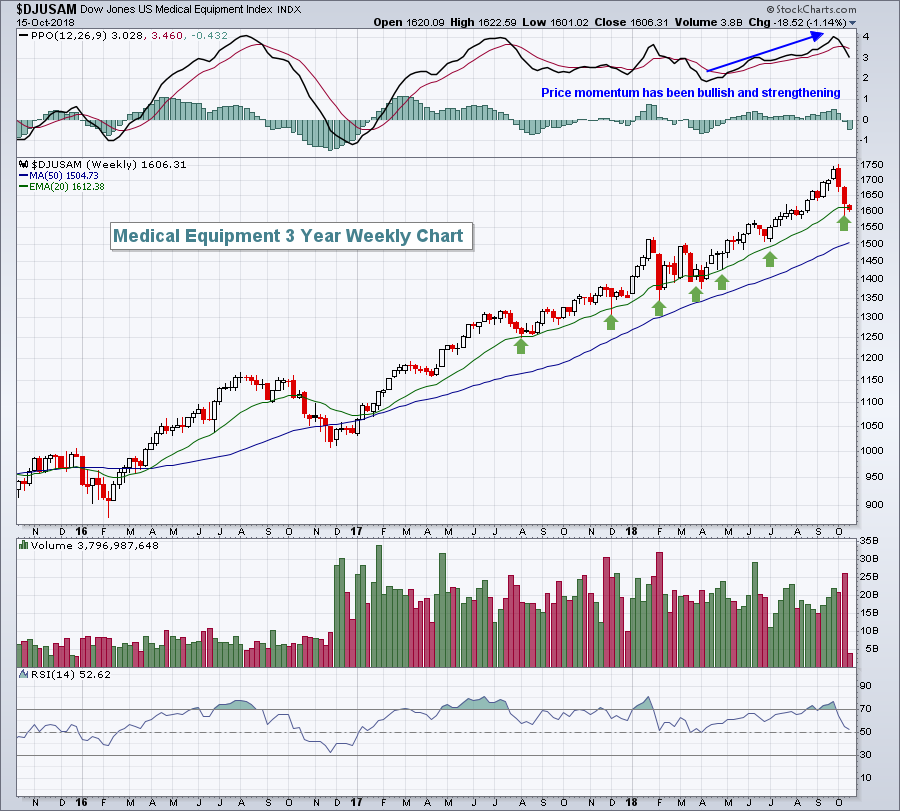
Medical equipment ($DJUSAM) performed poorly once again, extending a slide that began at the beginning of the month. This weakness, though, followed a very strong period of outperformance and the recent selling has set up a 20 week EMA test, a test that has a history of being quite successful over the past couple years:
 Based on the above, if the recent panic in the market settles down, I'd expect the DJUSAM to be among the leaders in its resurgence.
Historical Tendencies
There's no coincidence that the 10 year treasury yield tends to rise strongest during Q4, which also is a historically bullish quarter for banks.
Key Earnings Reports
(actual vs. estimate):
BLK: 7.52 vs 6.93
CMA: 1.86 vs 1.76
DPZ: 1.95 vs 1.73
GS: 6.28 vs 5.42
GWW: 4.19 vs 3.96
INFY: .13 vs .13
JNJ: 2.05 vs 2.03
MS: 1.17 vs 1.00
OMC: 1.24 vs 1.21
PGR: 1.14 - estimate, awaiting results
PLD: .72 vs .71
UNH: 3.41 vs 3.30
(reports after close, estimate provided):
CSX: .94
IBKR: .49
IBM: 3.40
LRCX: 3.21
NFLX: .68
UAL: 3.09
Key Economic Reports
September industrial production to be released at 9:15am EST: +0.2% (estimate)
September capacity utilization to be released at 9:15am EST: 78.2% (estimate)
October housing market index to be released at 10:00am EST: 67 (estimate)
Happy trading!
Tom
