Market Recap for Friday, July 27, 2018
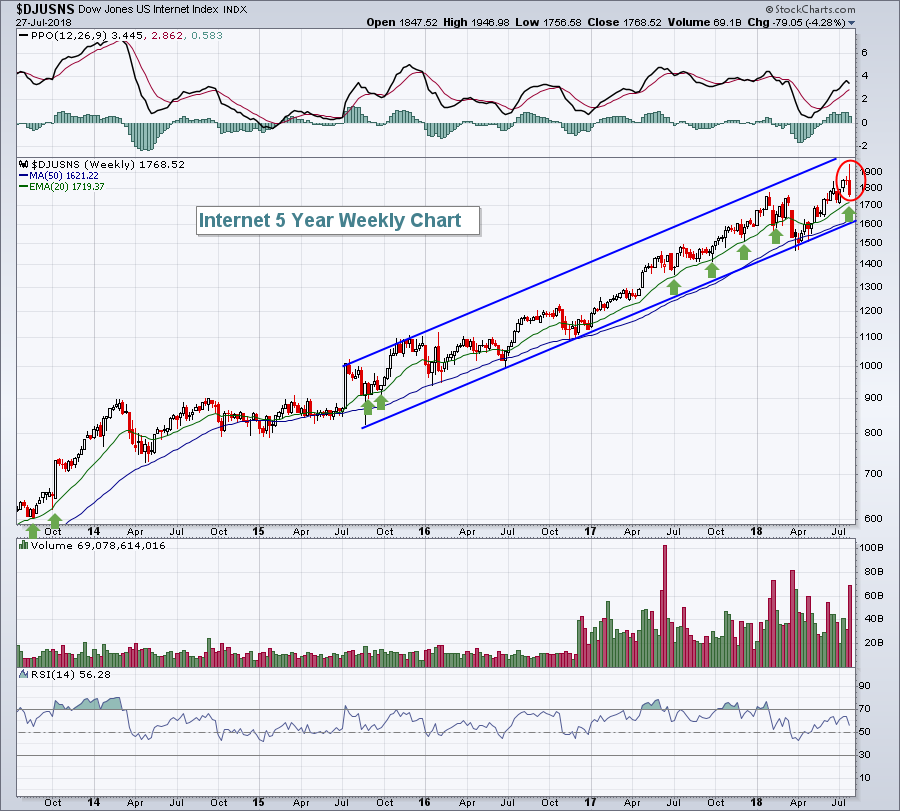
A second wave of internet troubles came in the form of Twitter Inc (TWTR) after the recently-soaring internet giant disappointed traders with its latest quarterly results. It was an UGLY reaction by Wall Street as TWTR fell nearly 21% exactly one day after Facebook's (FB) 19% haircut. These two earnings reports were responsible for a big reversal in internet stocks last week:
 The good news, I suppose, is that the DJUSNS had been on a tear and in the midst of a solid up channel. It had room for a decline, but after the selling late last week, we need to watch two levels carefully. The first is rising 20 week EMA support (green arrows), which has held as support on many previous occasions during short-term selloffs. Below that, channel support closer to 1600 potentially comes into play. If we see our normal summertime weakness/consolidation, the DJUSNS could slowly work its way back toward channel support and that wouldn't be a horrible thing. Historically, the DJUSNS performs best in September (+3.9% average monthly return) and October (+9.8%), its two best sequential calendar months over the past 20 years. Maybe a little selling in the near-term will set up bigger returns in the fall?
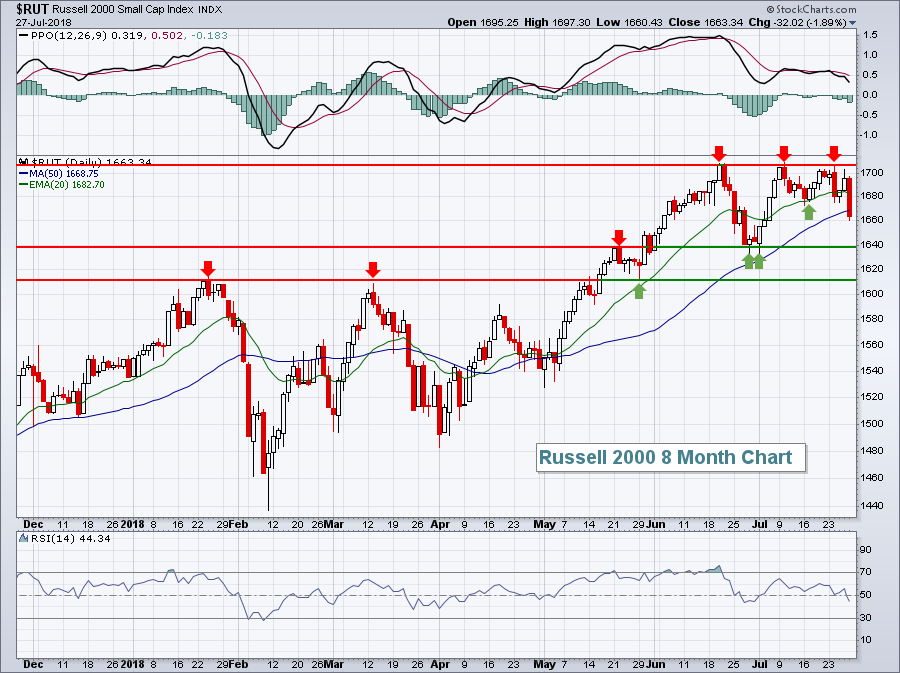
The effect on Friday was clear, however. The NASDAQ was hit much harder on a relative basis, dropping 1.46%, while the Dow Jones and S&P 500 shed just 0.30% and 0.66%, respectively. The Russell 2000 was the weakest link, falling 1.89% and losing short-term price support in the process. More on that below in the Current Outlook section.
Technology (XLK, -1.71%) was the clear loser on Friday, saddled with the weak internet group. Internet fell 4.28% for the week, but most of the selling in technology was confined to that industry. Half of the technology industry groups finished in positive territory last week with its hottest industry group - software ($DJUSSW) falling a mere 0.05% for the week.
Financials (XLF, +0.21%) and consumer staples (XLP, +0.13%) were able to hold the market together on Friday.
Pre-Market Action
The 10 year treasury yield ($TNX) is making another push towards 3.00%, currently higher by 2 basis points to 2.98%. Crude oil prices ($WTIC) have spiked more than 2.3% back above $70 per barrel. Asia was weak overnight and Europe is mixed.
As we near today's open, Dow Jones futures are slightly higher, up 37 points. Caterpillar (CAT) posted better-than-expected quarterly results this morning and is higher by nearly 3% in pre-market trading, lifting the Dow Jones.
Current Outlook
The Russell 2000 ($RUT) did manage to lose its initial price support level and it seemed that traders quickly took advantage, selling small cap stocks into the close. I remain a fan of the group as I fully expect to see the dollar rally further in the second half of 2018. But the advance is definitely on pause for now:
 Based on the above chart, either a low will be established somewhere between 1640-1660 to mark a key pivot within a bullish ascending triangle pattern or look for another test of support at 1640. I maintain a short-term bullish view of small caps so I'd really like to see that 1640 level hold. Otherwise, things get more dicey and a re-evaluation would be necessary.
Sector/Industry Watch
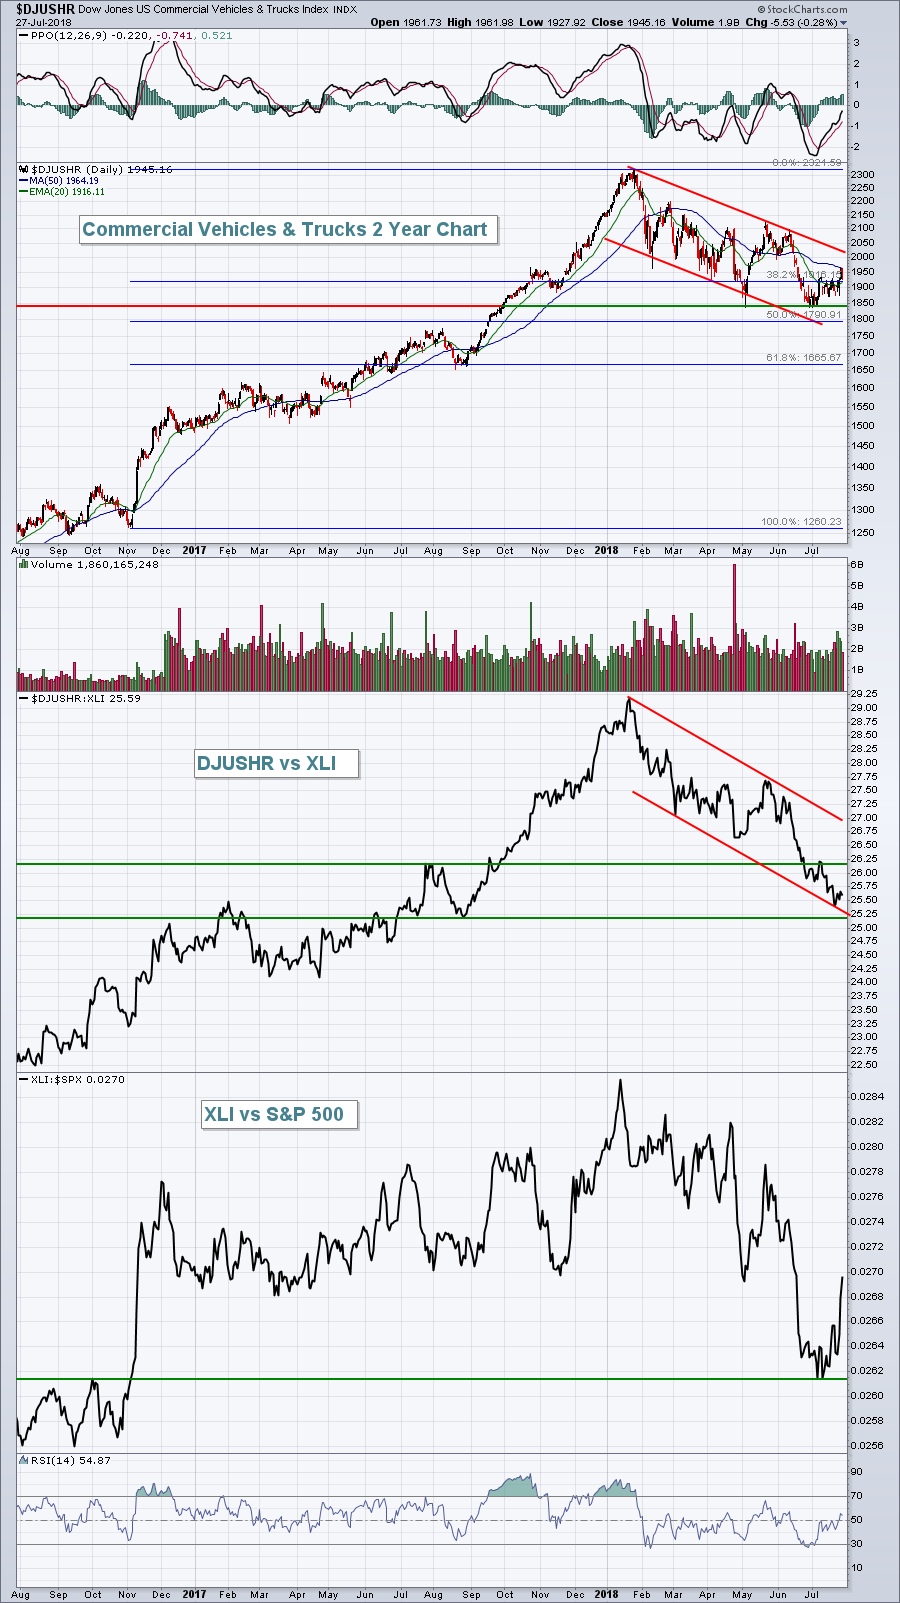
The Dow Jones U.S. Commercial Vehicles & Trucks Index ($DJUSHR) has been a very weak component of industrials, which in turn has been weak relative to the S&P 500. Here's a chart to illustrate:
 We do need to keep things in perspective here. 2018 hasn't been kind to the DJUSHR, but check out the advance from November 2016. Fibonacci retracement zones suggest support from roughly 1800-1900, so we may have already marked a bottom. Industrials, relative to the benchmark S&P 500 (XLI:$SPX), appear to have bottomed exactly where they broke out nearly two years ago. If the XLI continues to strengthen on a relative basis, watch for a channel breakout on the DJUSHR as that could signal re-emergence of leadership in this space.
Monday Setups
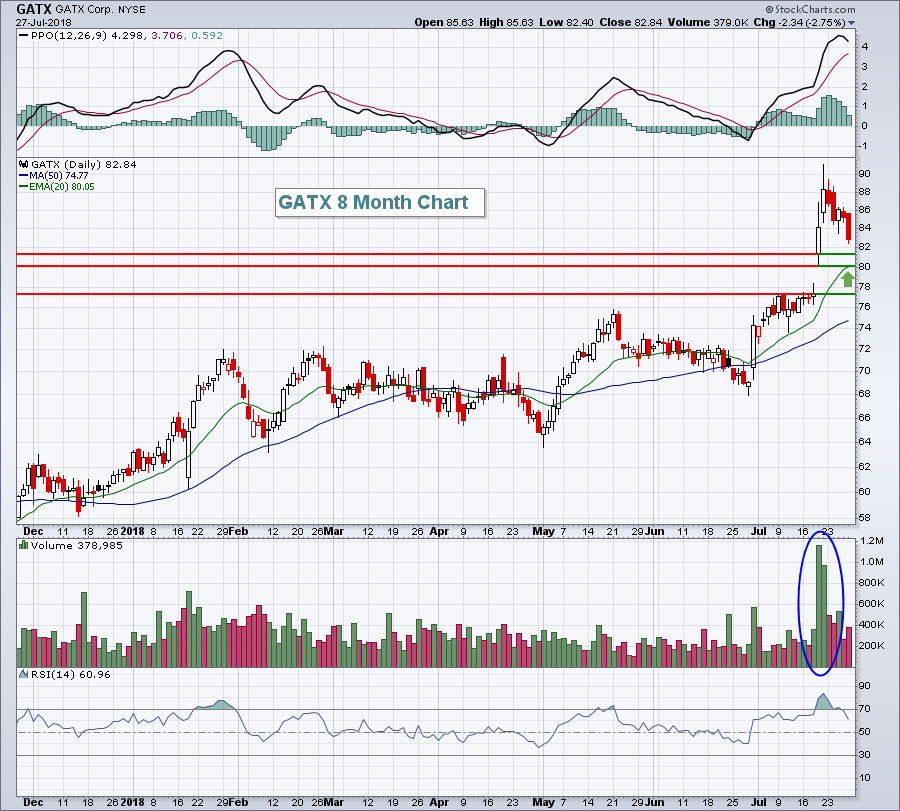
Commercial vehicles & trucks ($DJUSHR) have struggled in 2018, but there have been component stocks that have held up well. One such stock is GATX Corp (GATX), which is up 25% over the past three months despite an industry group that has lagged the overall market badly. GATX recently reported excellent quarterly results and it's now pulled back close to 10% from its post-earnings price high. I might be a little early as there's still a bit of downside possible to key price and gap support levels, but the reward to risk is improving with every dollar it drops:
 Check out the DJUSHR chart in the Sector/Industry Watch section above. GATX has performed well despite money rotating away from industrials and away from commercial vehicles & trucks.
Historical Tendencies
The 26th through 6th period of the monthly calendar has easily been the most bullish since 1950 on the S&P 500. It's produced annualized returns of 20.47%. While the 26th through 6th accounts for roughly 33% of the calendar month, it's accounted for approximately 75% of the S&P 500's gains over the past seven decades. Your odds of shorting stocks successfully diminish during this period simply based on historical tendencies.
Key Earnings Reports
(actual vs. estimate):
CAT: 2.97 vs 2.66
CNA: .99 vs .96
FDC: .39 vs .37
L: .76 vs .73
ON: .46 vs .45
SPG: 2.98 vs 2.91
(reports after close, estimate provided):
AVB: 2.19
ILMN: 1.11
KLAC: 2.14
SBAC: .18
VNO: .97
Key Economic Reports
June pending home sales to be released at 10:00am EST: +0.8% (estimate)
Happy trading!
Tom
