Market Recap for Thursday, July 26, 2018
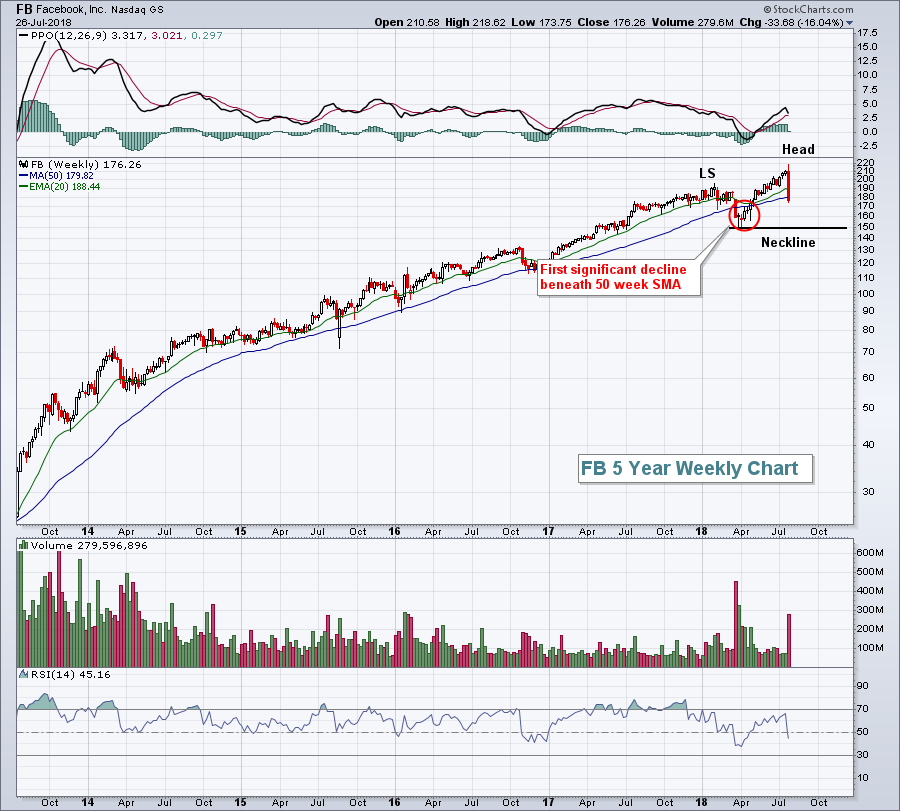
There was clear market bifurcation on Thursday as The Travelers Cos (TRV) and Walt Disney Co (DIS) both gained more than 2% to lead the Dow Jones Industrial Average to a 113 point gain. Five other Dow components gained more than 1%, while only McDonalds (MCD) and Microsoft (MSFT) managed to lose more than 1% and the latter's drop was due more to profit taking than anything else after a stellar recent earnings report and advance. Meanwhile, Facebook (FB, -19.00%) tumbled after shocking Wall Street with an awful quarterly earnings report. They missed their quarterly revenue estimate for the first time in 14 quarters, then lowered their revenue forecast for both Q3 and Q4. They didn't stop there. FB CEO Mark Zuckerberg said that FB's operating margin would begin trending toward the mid-30% range. Wall Street was expecting operating margins for the next two years to be 45% and 44%. These weren't slight misses, they were character-changing bombs that FB dropped on analysts and investors. Take a look at the big picture on FB:
 In my experience, Wall Street is not a very forgiving place. FB traded at an all-time high at Wednesday's close, just before FB announced its horrendous results and forecast. Nobody had a clue that FB was about to release a bomb on Wall Street. Companies trade off of management forecasts, assuming that Wall Street believes those forecasts. I haven't witnessed too many situations where a company was able to trade as though there wasn't a worry in the world, only to unleash a massive valuation problem. Companies are valued based on projected growth rates and FB just lowered theirs.....by a mile! FB didn't tell anyone about this warning going forward. If they had, the stock would have been downtrending heading into earnings.
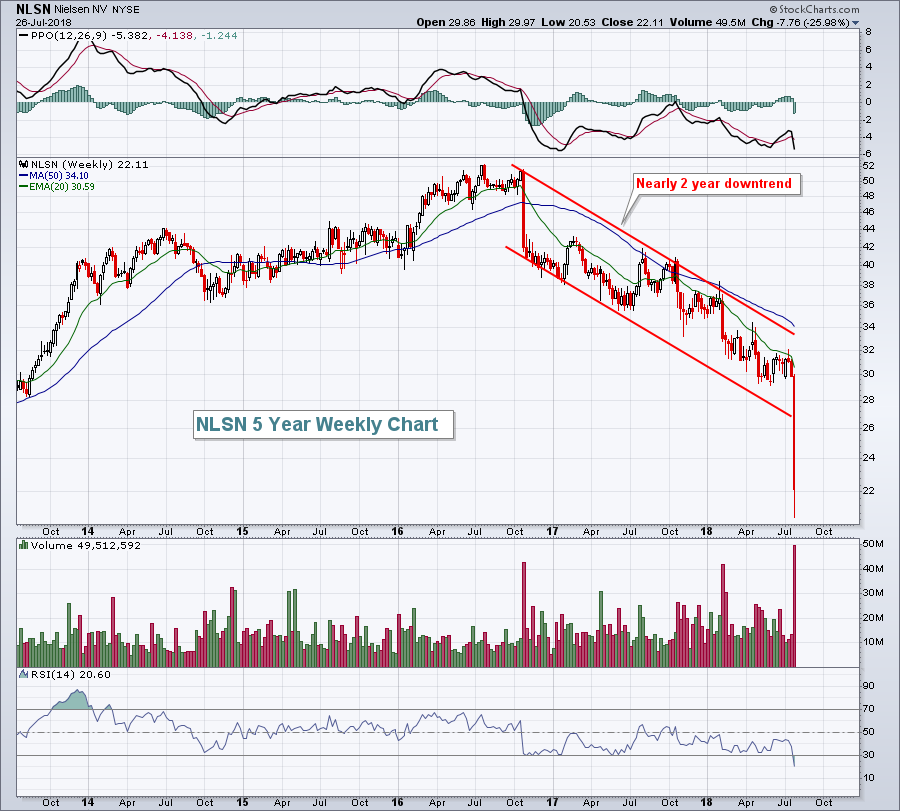
Let's take a look at Nielsen (NLSN), who actually performed worse than FB yesterday and had the distinction of being the worst performing stock on the S&P 500 yesterday. They produced an abysmal quarterly report, but at least the market wasn't anticipating blowout earnings. Check out how NLSN has traded over the past five years:
 Say what you want about NLSN, but at least they didn't mislead Wall Street. The stock downtrended for nearly two years and investors/traders needed only to look at the chart to figure out things weren't very good at the company. But in FB's case, management misled Wall Street and that is inexcusable. Perhaps FB will get a pass because it's such a visible company, but I doubt it. I see FB moving lower, much much lower. Look initially for a neckline test at 150. I believe in an old Wall Street adage that says, "there's never just one cockroach in the kitchen." I'd avoid FB.
Pre-Market Action
Amazon.com (AMZN) fell short of its expected revenue numbers for its latest quarter, but managed to double its expected EPS ($5.07 vs $2.49) and traders are sending AMZN shares more than 4% higher in pre-market trading. AMZN is likely to clear $900 billion in market cap for the first time ever, challenging Apple (AAPL) as the first company to boast a $1 trillion market cap. AAPL currently has a $954 billion market cap and reports its latest quarterly results next week.
Twitter (TWTR) reported earnings this morning that matched Wall Street's consensus estimate. Unfortunately for TWTR shareholders, that simply wasn't good enough and TWTR looks to fall approximately 10% at today's open.
Asian markets were mixed overnight, European shares are higher and the 10 year treasury yield ($TNX) is relatively flat. With a little less than 30 minutes left to the opening bell, Dow Jones futures are relatively flat, up just 9 points.
Current Outlook
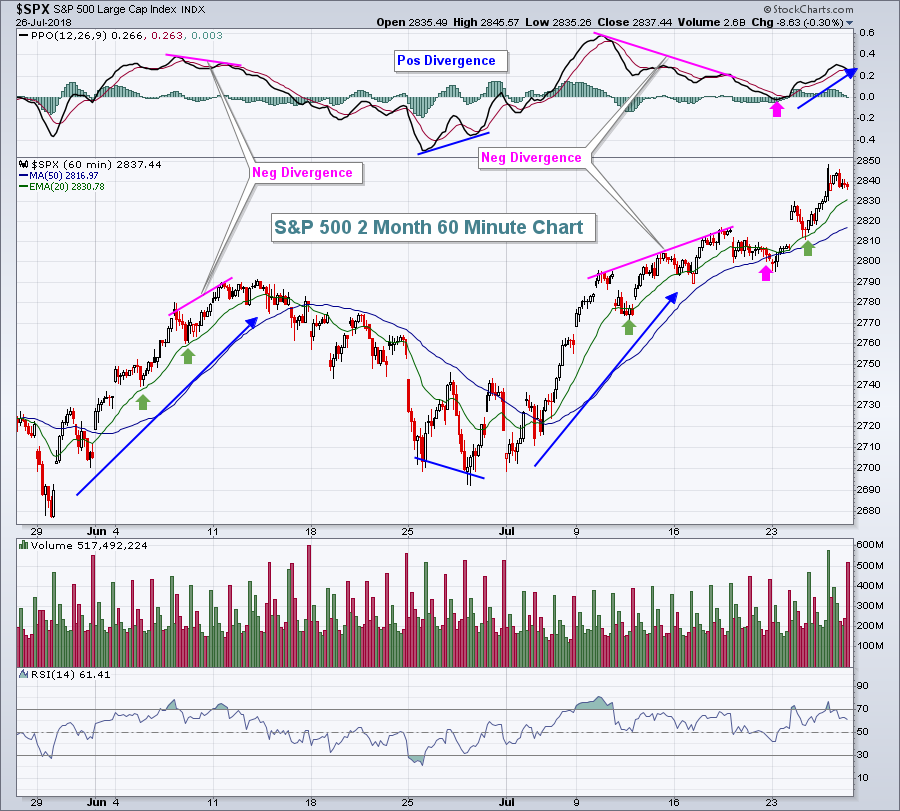
60 minute charts can help to provide us clues what to look for. When negative divergences emerge, we typically see a reversal as these divergences point to slowing buying momentum. Positive divergences suggest slowing selling momentum. The following chart of the S&P 500 shows how these look and what we can expect as a result:
 Let's start with the June uptrend. Each time price rises, the PPO rises to a new high as well. That's a signal of a sustainable rally with 20 hour EMAs providing support (green arrows). But do you see that final high in the second week of June? The PPO has rolled over and is beginning to turn lower. This means that our shorter-term exponential moving average (12 hour EMA) is no longer pulling away from its longer-term exponential moving average (26 hour EMA). It's sign of slowing price momentum and many times provides a warning of a temporary reversal in trend, possibly a long-term reversal. In late June, the opposite occurs. Price action continues to move lower, but at the very bottom as price hits a new low, note that the PPO has a higher low. That's a positive divergence and tells us that selling momentum is potentially slowing.
At the mid-July high, the PPO was providing similar warnings as a negative divergence printed. In this case, however, it was simply a brief pause with a 50 hour SMA test and PPO centerline test (green arrows). That "reset" the PPO at zero. A zero reading on the PPO tells us that the 12 period and 26 period EMAs are exactly the same. Therefore, momentum starts over. Since that PPO centerline test, the S&P 500 has resumed its upward thrust and as price action has moved higher, so has the hourly PPO. Therefore, for now, I'd look for the rising 20 hour EMA to provide support on pullbacks. That's close to the 2830 level.
Sector/Industry Watch
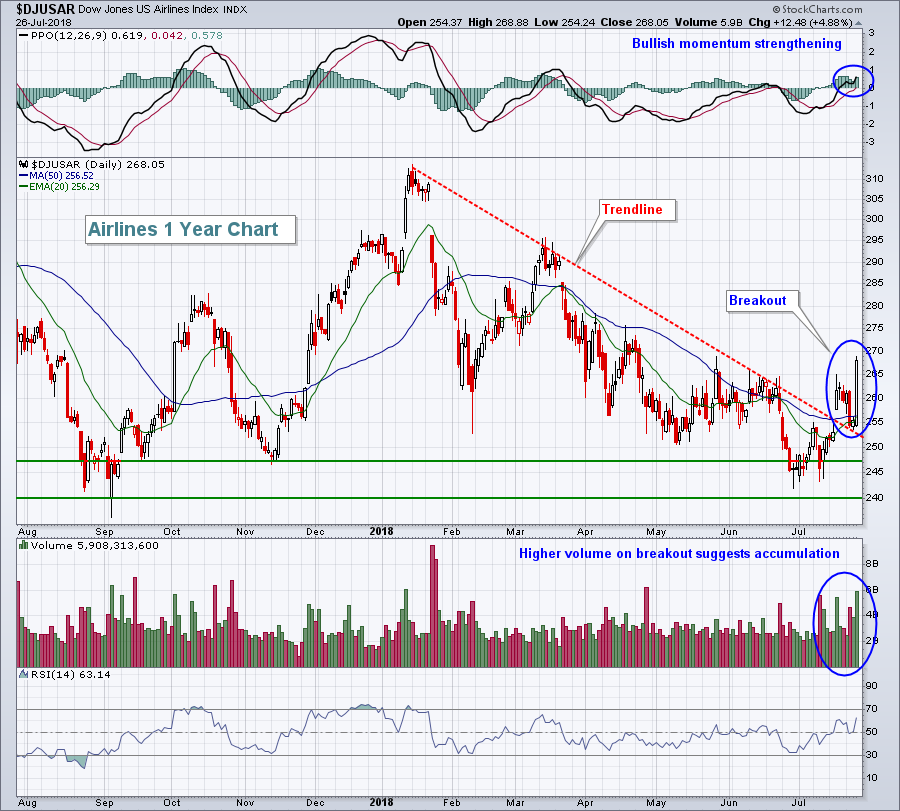
Airlines ($DJUSAR) had been trapped in a downtrend throughout much of 2018, but recently appeared to break that downtrend on solid volume. After pulling back to test the now-rising 20 day EMA, the DJUSAR broke out again on Thursday and appears poised to rise further:
 Note that Thursday's strength and close cleared key short-term price resistance near the 265 level, where previous rally attempts had failed.
Historical Tendencies
Over the past 30 years, the Russell 2000 has gained ground during the month of August 16 times while losing ground 14 times. It's produced annualized returns of -7.50% over this span, making August the worst calendar month of the year for small cap stocks. I like the technical conditions currently for small caps and believe the U.S. Dollar Index ($USD) will rise, aiding small cap performance. But it's still important to recognize historical tendencies....and they do not favor small caps next month.
Key Earnings Reports
(actual vs. estimate):
ABBV: 2.00 vs 1.98
AON: 1.71 vs 1.63
CL: .77 vs .77
COL: 1.73 vs 1.89
CVX: 1.78 vs 2.06
E: .50 vs .66
FMX: vs .98 (estimate, results not yet available)
MCO: 2.04 vs 1.88
MRK: 1.06 vs 1.03
PSX: 2.80 vs 2.16
SYF: .92 vs .82
TWTR: .17 vs .17
WY: .44 vs .41
XOM: .92 vs 1.26
ZBH: 1.92 vs 1.88
Key Economic Reports
Q2 GDP released at 8:30am EST: +4.1% (actual) vs. 4.2% (estimate)
July consumer sentiment to be released at 10:00am EST: 97.1 (estimate)
Happy trading!
Tom
