Market Recap for Monday, July 9, 2018
In the famous words of Yogi Berra, it was "deja vu all over again" as financials (XLF, +2.29%) and industrials (XLI, +1.86%) returned to the top of the sector leaderboard. Life insurance ($DJUSIL, +2.78%) and banks ($DJUSBK, +2.67%), major historical beneficiaries of rising interest rates, soared. Was it a case of simply being oversold and bouncing off support? Or was it the start of a significant uptrend? I'm casting my vote for the former. While the short-term charts look rather bleak with mostly downtrending prices in 2018, the longer-term weekly charts of these two industry groups look much more bullish in my view.
First, the life insurance companies:
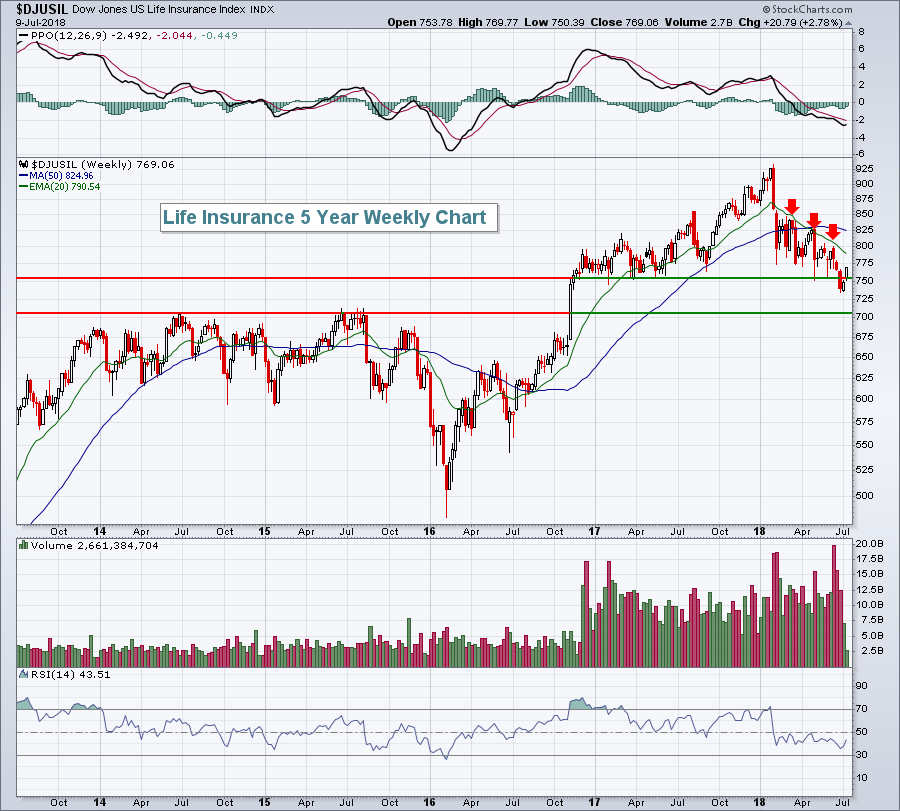 The downtrend in 2018 is rather apparent, but I see two key levels of price support longer-term. The first was near 755 and we briefly penetrated and then recaptured that level. The second level of price support was the breakout of multiyear price resistance at 705. Losing that level would be extremely bearish, but I doubt we even get there. The bullish confirmation I'm looking for is a weekly close back above the declining 20 week EMA.
Now the banks:
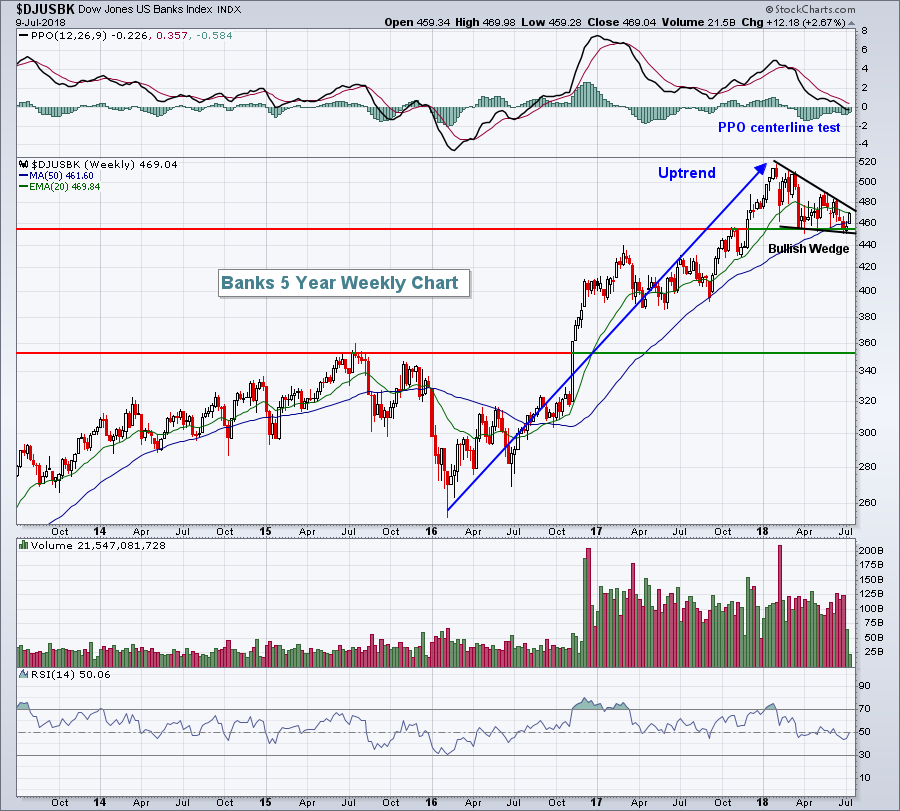 I see very little deterioration in banks. Yes, they've underperformed in 2018, but that was after significant outperformance during the prior two years. The weekly RSI recently touched the low 40s, an area where I'd expect resumption of the prior uptrend. We've been consolidating in a bullish wedge and a breakout above 470, especially 480, would likely confirm the beginning of the group's next extended rally. We'll get the latest quarterly results from four large banks on Friday - Citigroup (C), JP MorganChase (JPM), PNC Financial (PNC) and Wells Fargo (WFC) and that will help to shape the short-term direction of this space.
Utilities (XLU, -3.08%) experienced a rude reversal to its recent uptrend as traders reminded defensive-oriented investors that the current bull market is alive and well. Consumer staples (XLP, -0.38%), another defensive sector, was the only other sector to finish Monday in negative territory.
Pre-Market Action
Crude oil ($WTIC) is trading back above $74 per barrel, while gold ($GOLD) is dropping back to $1250 per ounce. Asian markets were mostly higher overnight, as are most European markets this morning.
Dow Jones futures are higher by 27 points as we move closer to the start of Q2 earnings reports.
Current Outlook
There was a negative divergence on the U.S. Dollar Index ($USD) daily chart that suggested upside momentum had slowed for the greenback as we reached the 95 level in June. As a result, I was anticipating short-term dollar weakness to perhaps test the rising 50 day SMA. That occurred yesterday:
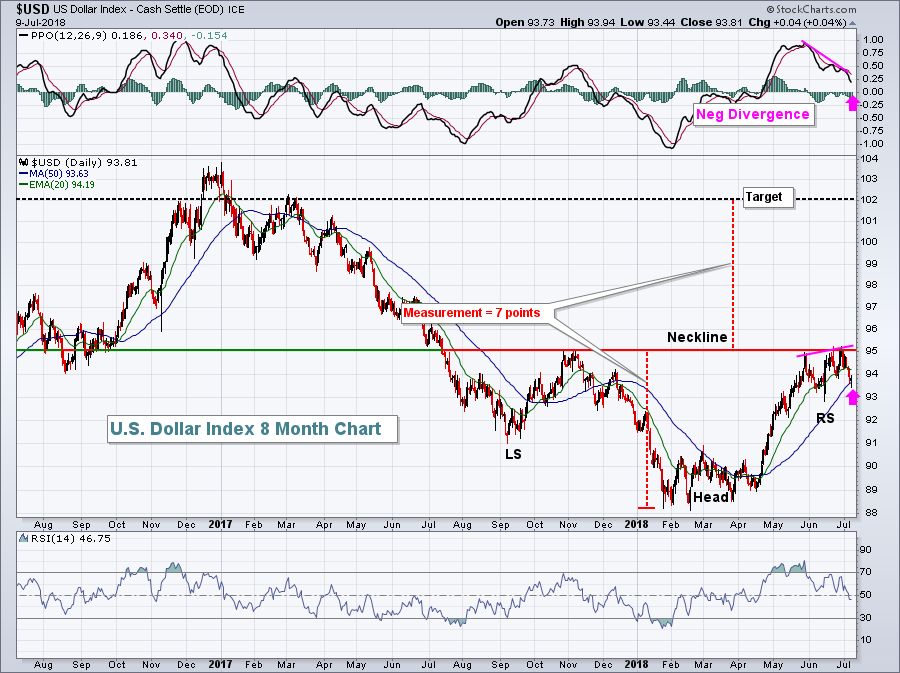 The big picture outlook here remains quite bullish in my view. Technically, the reverse head & shoulders has a depth of 7 points so a breakout above 95 would initially measure to 102. If that occurs, expect to see small caps continue to outperform its large cap counterparts. Fundamentally, the U.S. 10 year treasury yield ($UST10Y) continues to rise faster than the German 10 year treasury ($DET10Y). This difference ($UST10Y-$DET10Y) can be plotted on a SharpChart and it has a very strong positive correlation with the direction of the USD:
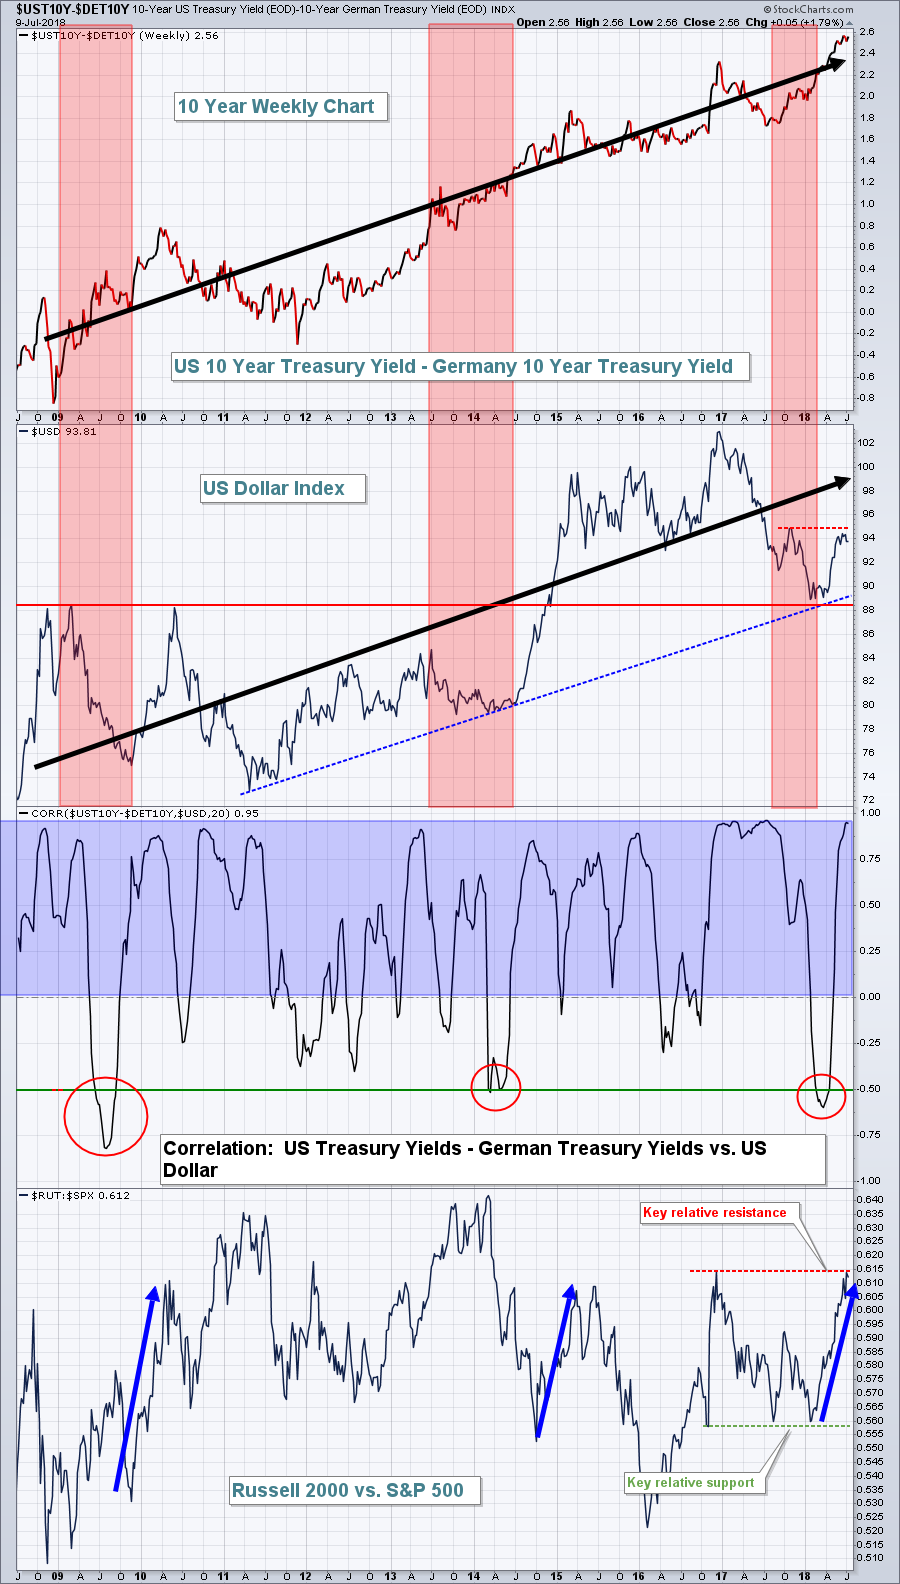 There are undeniable consequences to a rising dollar. One is small cap outperformance and it can, at times, be very significant. The first half of 2018 was one of those periods and I fully expect to see small caps deliver better returns during the second half as well. I expect the relative resistance on the $RUT:$SPX to be broken as the $USD breaks its neckline resistance at 95.
Sector/Industry Watch
The Dow Jones U.S. Media Agencies Index ($DJUSAV, +0.46%) continues to strengthen and is rapidly approaching a major long-term price resistance level. I've been watching this group patiently throughout 2018 and many small cap stocks within the industry have already broken out. It seems like it's just a matter of time before the index does the same:
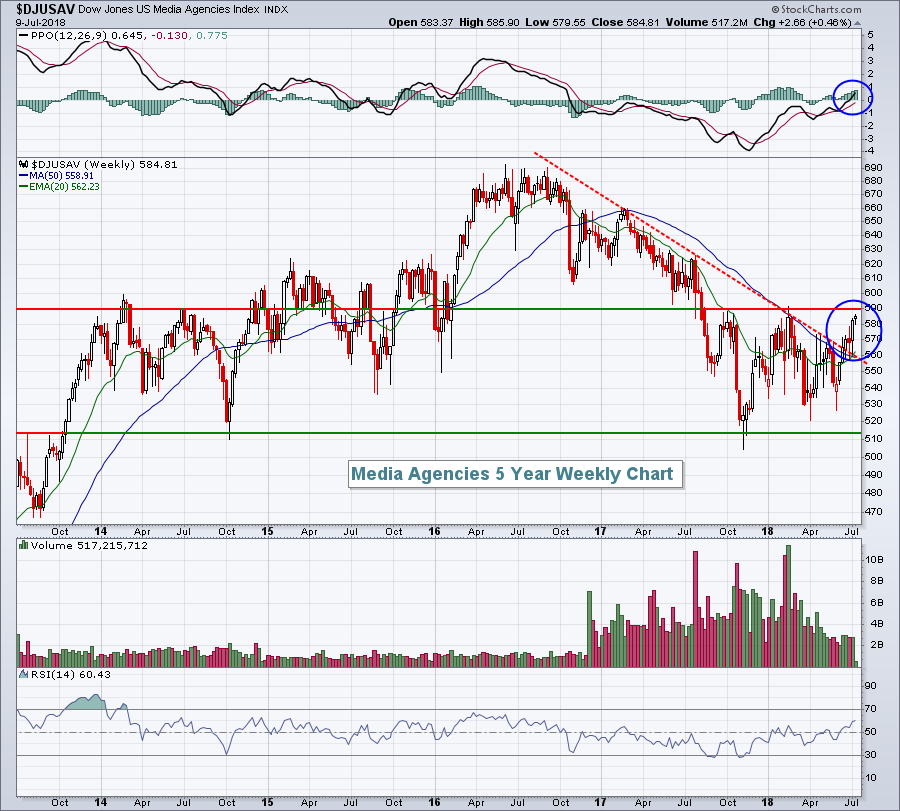 The downtrend line has already been broken and we've seen the weekly PPO move bullishly through its centerline for the first time in nearly two years. The only barrier left seems to me to be price resistance close to 590. If we get that breakout, I'd look for leadership from this industry during the balance of 2018.
Historical Tendencies
Here's an interesting stat. Over the past three decades, the Russell 2000 (small caps) has produced annualized returns as follows during the following periods of all calendar months:
25th through 5th: +27.72%
6th through 24th: +0.46%
Key Earnings Reports
(actual vs. estimate):
PEP: 1.61 vs 1.51
Key Economic Reports
None
Happy trading!
Tom
