Market Recap for Friday, July 6, 2018
It was a solid close to the week on Friday, especially on the tech-laden NASDAQ where that index rose 101 points, or 1.34%. Biotechnology stocks ($DJUSBT, +3.74%) surged on news of positive trial results for Biogen's (BIIB, +19.63%) Alzheimer's drug. Most biotechs rose in sympathy. The Dow Jones also gained, but its advance was much less robust and continues a serious period of underperformance by this index of behemoth, multinational companies. The underperformance of the Dow Jones relative to the NASDAQ is quite noteworthy:
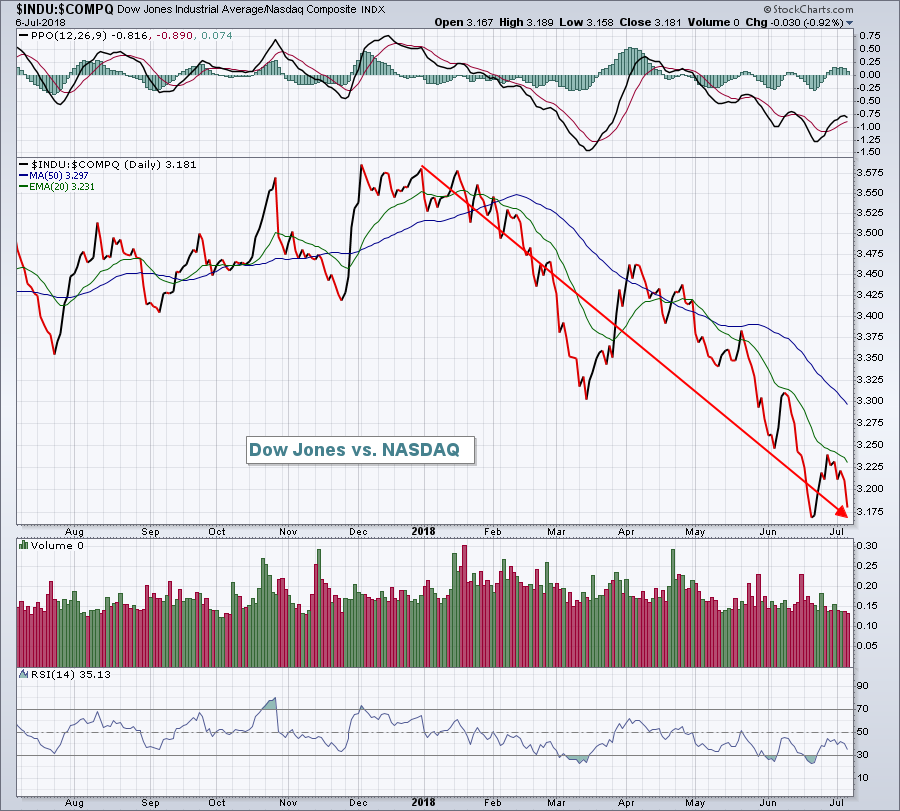 2018 has not been nearly as good a year for Dow Jones stocks as it's been for NASDAQ stocks.
Healthcare (XLV, +1.44%), on the heels of a very strong biotech industry, and technology (XLK, +1.17%) were the two clear leaders on Friday. Every industry group rose in both sectors, but biotechs and internet ($DJUSNS, +1.78%) were the best performing industries. It also didn't hurt to see Apple (AAPL) bounce exactly where I'd expect it to on a technical basis:
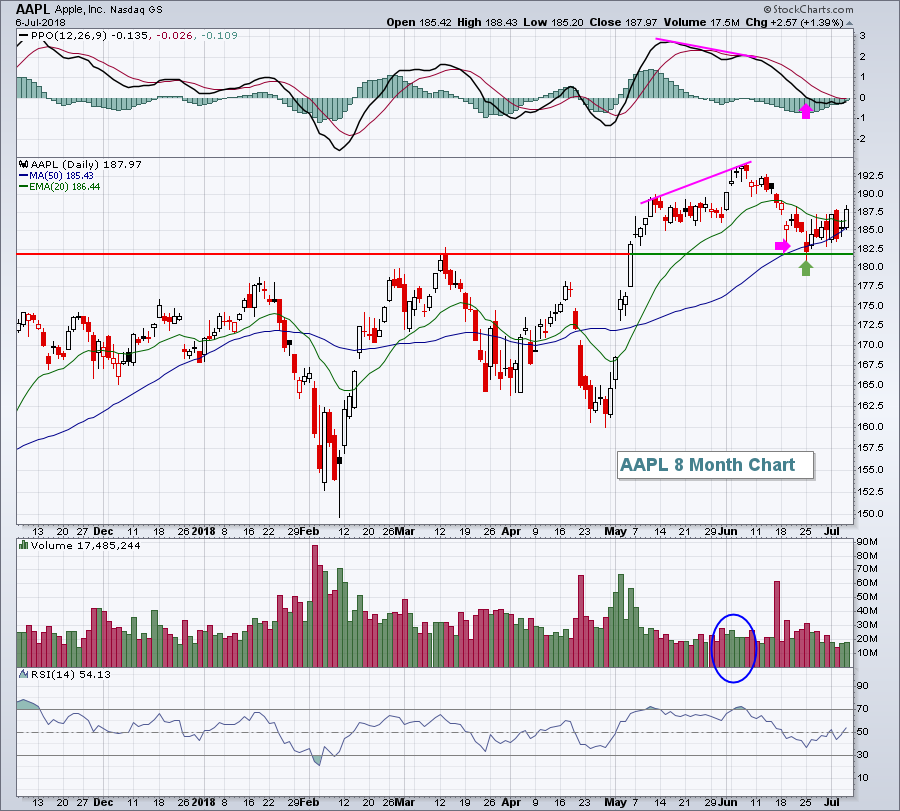 The pink lines highlight the negative divergence and the blue circle shows that the last breakout was accompanied by lighter than normal volume. These are both signals of slowing momentum. When a negative divergence prints, I look for a PPO return to its centerline and price action to return to its 50 period SMA (in this case 50 day SMA). The pink arrows illustrate the occurrence of both. In addition, AAPL's 50 day SMA test coincided with its test of price support at 182. AAPL now appears to be strengthening into its next quarterly earnings report, due out later this month.
Pre-Market Action
The 10 year treasury yield ($TNX) is up 2 basis points to 2.85%, while gold ($GOLD) is up $8 per ounce to $1264. Crude oil ($WTIC) is back on the rise and nearing $74 per barrel once again. Global markets are higher and U.S. stocks appear poised to follow suit. Dow Jones futures are higher by 103 points with just under 30 minutes left to the opening bell.
Current Outlook
The S&P 500 broke its short-term downtrend last week and now is pointing to a key test of price resistance near 2800. Breaking above this level would be extremely bullish. In the meantime, watch for solid support at the rapidly increasing 20 day EMA:
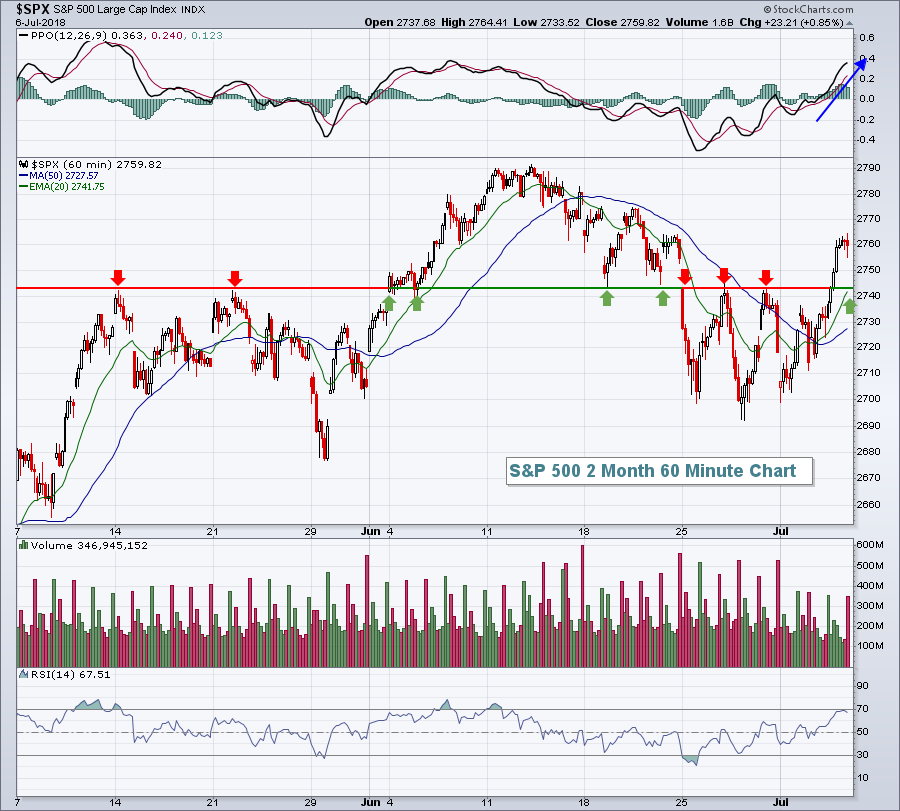 The 20 day EMA is currently at 2742 and you can see that the horizontal line near 2744 has marked critical support/resistance over the past two months. I'd look for that level to hold as support during any weakness in the near-term. The mid-June high just above 2790 is the target I'd look for this week. Can we break through?
Sector/Industry Watch
The Dow Jones U.S. Clothing & Accessories Index ($DJUSCF) has been one of the top performing groups in 2018. There's been a reasonable pullback of late, however, and it could be setting up an opportunity in this space:
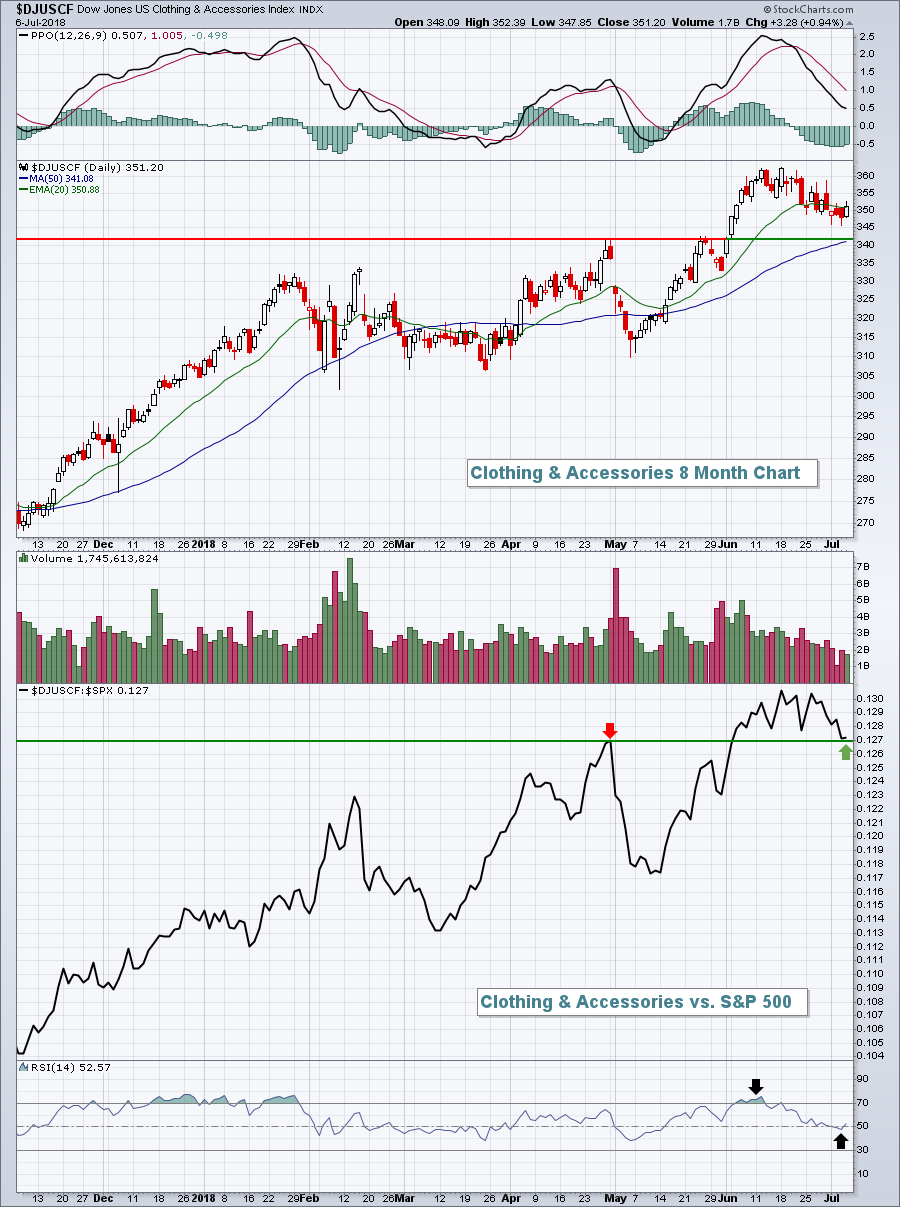 The relative strength line ($DJUSCF:$SPX) has hit relative support and the RSI of the index has fallen from very overbought in the mid-70s a few weeks ago to a much more palatable level just beneath 50 late last week.
Historical Tendencies
Since 1950, the 9th calendar day of the month has been the second worst on the S&P 500, trailing only the 19th. Here are the 5 worst days on the S&P 500 based on annualized performance:
19th: -33.44%
9th: -17.61%
22nd: -11.87%
7th: -10.84%
25th: -8.18%
Monday Setups
Polo Ralph Lauren (RL) surged higher on massive volume 6-7 weeks ago after swamping its revenue and EPS estimates. It's since backed well off those highs, testing its 50 day SMA on much lighter volume with an RSI reading that has dropped from the mid-80s down to 43 at Friday's close:
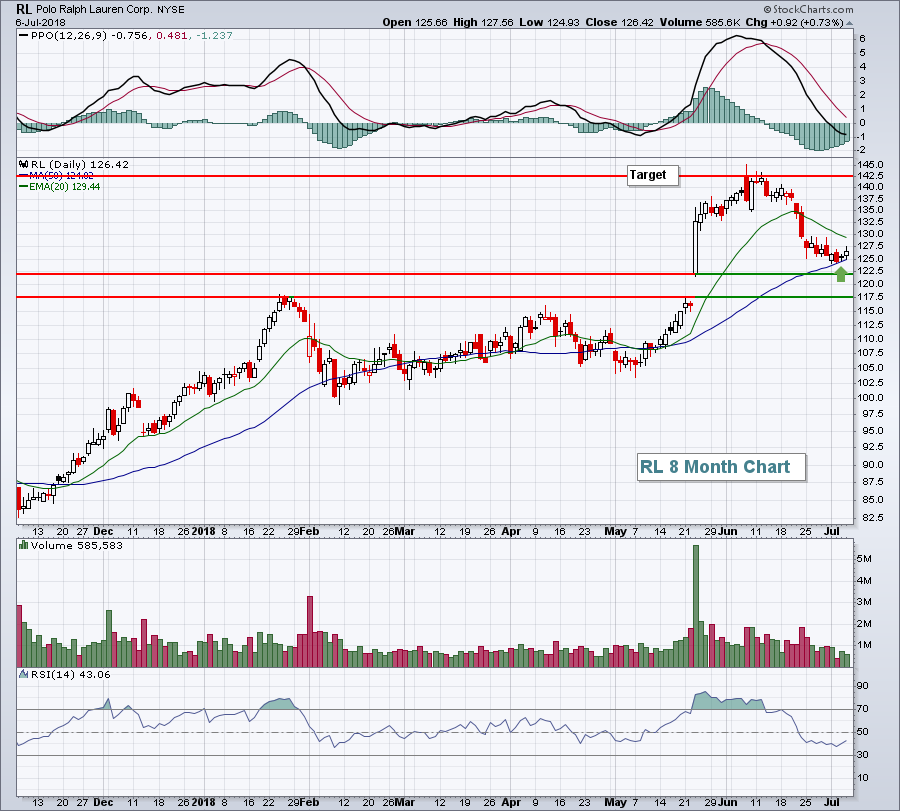 I'd look for the top of gap support at 122.50 to be very solid closing support. It would be the best entry point, if RL moves that far down. Given a target of 142.50 to test the June high, RL already makes sense as a nice reward to risk trade.
Key Earnings Reports
None
Key Economic Reports
None
Happy trading!
Tom
