Market Recap for Thursday, April 19, 2018
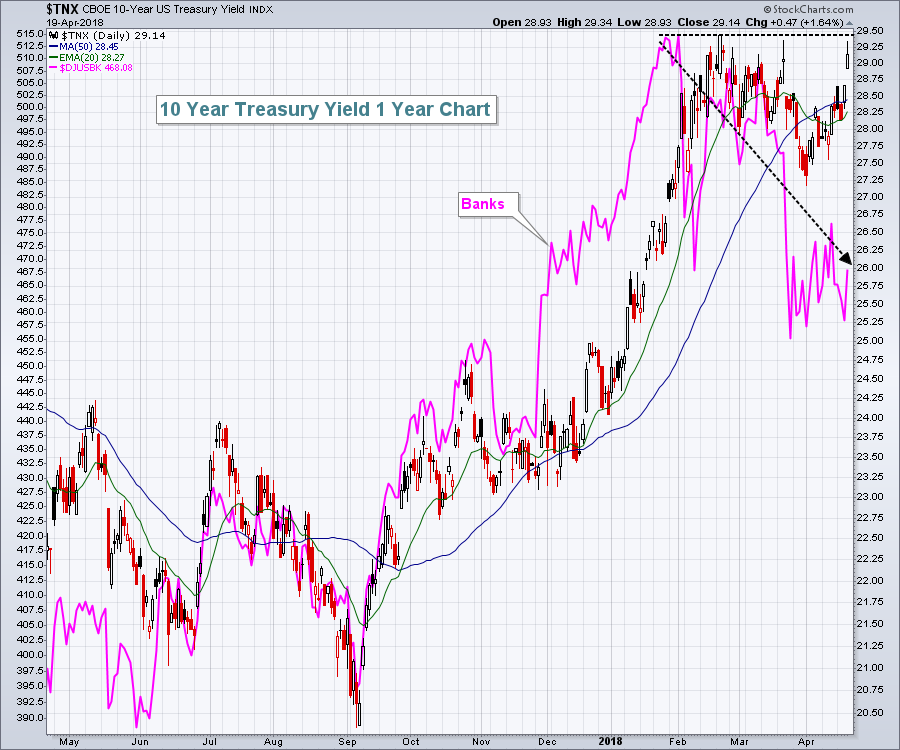
The U.S. stock market has been solid throughout April thus far, so seeing a Thursday drop of 0.57% and 0.78% on the S&P 500 and NASDAQ, respectively, shouldn't be too alarming. And it wasn't. But yesterday was not a day of across-the-board fractional losses. There was major strength in some areas and serious selling in others. One reason was the dramatic rise in the 10 year treasury yield ($TNX), which at one point rose above 2.93% and near a very important yield resistance at 2.94% - the high established earlier this year. That February 2018 high set a 4+ year high in the TNX and was one of several reasons for our recent correction and the surge in the Volatility Index ($VIX) that spooked traders.
The sudden spike in the TNX was a boon to many financial stocks (XLF, +1.53%), especially banks ($DJUSBK, +2.10%) as rising treasury yields result in higher profits. I wrote about the banks recently, but yesterday's recovery was important technically as support held. I'm of the opinion that banks could begin playing catch up to the resurgence in treasury yields:
 There's clearly a tight positive correlation between the TNX and DJUSBK, but not for the past 2 1/2 months. Should the TNX break out above 2.95%, I would expect to see banks make a strong move higher to narrow this gap.
While financials were obviously the market darling on Thursday, consumer staples (XLP, -2.89%) were hit by multiple downgrades among key consumer staples stocks like Clorox (CLX, -5.97%) and negative earnings reactions to Philip Morris (PM, -15.58%), Proctor & Gamble (PG, -3.27%) and Unilever (UL, -2.53%). All 10 consumer staples industry groups fell, led by a very weak tobacco group ($DJUSTB, -11.52%).
Broadline retailers ($DJUSRB) traded against the grain on Thursday, with Amazon.com (AMZN) paving the way higher. AMZN rallied another 1.90% and is now more than 200 points higher than its early April low. Semiconductors ($DJUSSC) were on the other side of the spectrum, under heavy selling pressure, dropping 3.83%.
It was truly anything but a boring fractional loss kinda day on Wall Street.
Pre-Market Action
We saw a reversal in crude oil prices ($WTIC) on Thursday and that could lead to a bit of short-term price weakness. At last check, crude oil is down about 0.50% this morning. Weakening crude oil prices could result in profit taking in energy shares (XLE), but I'd be mostly concerned with very near-term action - a couple of days vs. weeks or longer.
There was mostly weakness overnight in Asia, while Europe is mixed this morning. U.S. stocks, on the heels of some selling on Thursday, are possibly setting up to continue that slide. Dow Jones futures are lower by 29 points with an hour to go to the opening bell.
Current Outlook
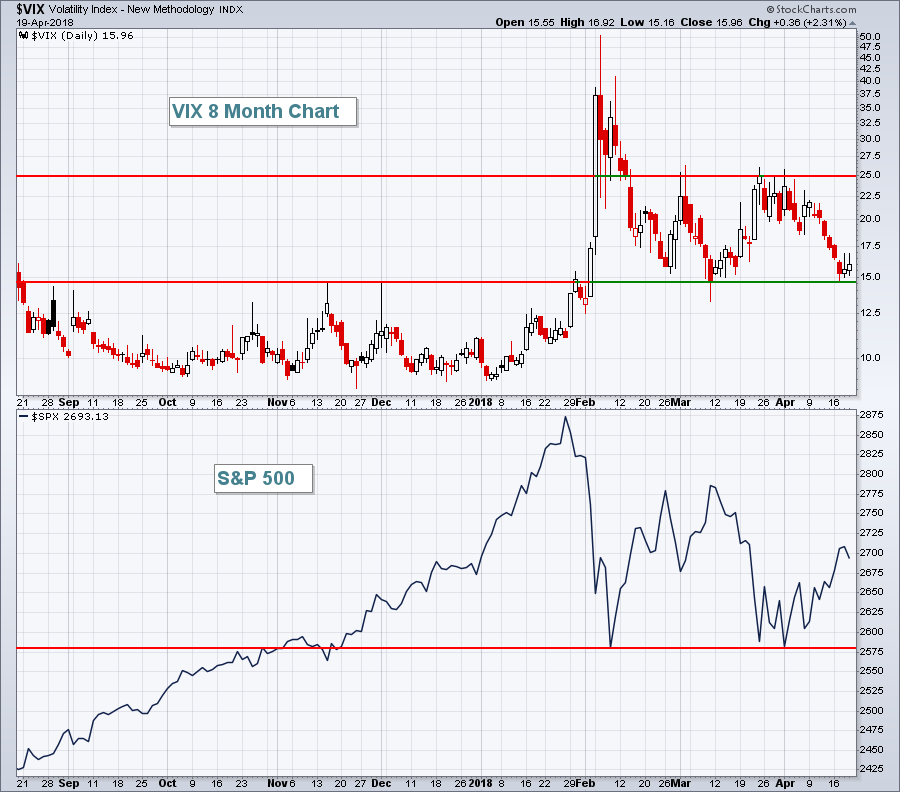
The Volatility Index ($VIX), after failing to break above a key high in late-March, is now testing a key low from earlier in March. For those believing we're mired in the beginning of our third 21st century bear market, I have one warning for you. Bear markets require a certain level of nervousness. In both of the prior bear markets, 2000-2002 and 2007-2009, the VIX never fell below 16-17 support after the initial VIX thrust above 20. Here's a current look at the VIX:
 Here are a few takeaways from the above chart:
(1) The VIX trends only for very short periods to the upside. If you look at a long-term chart of the VIX, you'll see price action that spikes, then retreats, spikes, then retreats. In my opinion, using normal trend-following indicators like moving averages is absolutely useless. Momentum indicators like PPO, MACD, RSI, Stochastic, etc. also are rendered useless.
(2) The most important uses of the VIX, again in my opinion, is (a) what level are we at? Anything above 16-17 tells me that we're in a dangerous, volatile market that should be respected....and (b) in which direction are we currently trending? An uptrending VIX that's above the key 16-17 resistance level has historically resulted in violent episodes of selling. We just experienced exactly that in February and March. In most cases, I move to the sidelines for significant periods of time (few days to a few weeks) to eliminate this trading risk. Some view high volatility as an opportunity to make money fast. I view it as a dangerous period where months of hard-earned gains can disappear in a couple days.
(3) Watch the March low. A sustained move beneath that low suggests we have seen the end of this correction with more frustration ahead for the bears.
(4) If you're bearish, you want to see fear (much higher VIX) return in a big, big way.
Sector/Industry Watch
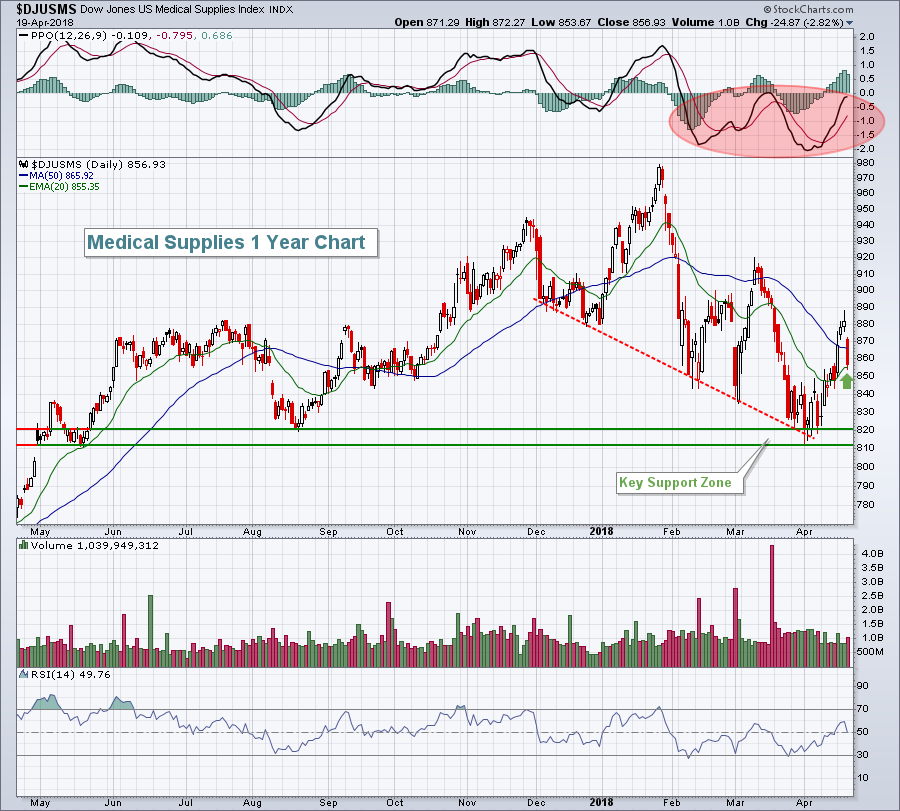
Medical supplies ($DJUSMS) will be worth watching to see if its recent uptrend can be sustained. The first sign of such bullish action would be to hold its now-rising 20 day EMA:
 The PPO has been accelerating upward to test centerline resistance, but we saw this once before - back in the second week of March. I believe there's a better chance the uptrend now continues, mostly because I'm looking for bull market rules to apply.
Historical Tendencies
Now that the pre-earnings run up season has ended (April 1st through April 18th), we've entered two days of historical weakness - April 19th (yesterday) and April 20th (today). Options expire today and we've seen really strong action this month. It would make sense for the market to cool off for a bit into the week after options expiration.
Since 1971 on the NASDAQ, the April 19th through April 28th period has produced results just slightly below the average produced throughout the year. The annualized return for this period has been +8.27% over the past 46 years. The good news? U.S. stocks have a history of performing extremely well from the end of April through the first week of May. More on that in an upcoming Trading Places article.
Key Earnings Reports
(actual vs. estimate):
BHGE: .09 vs .06
CFG: .78 vs .76
ERIC: .01 vs (.03)
GE: .16 vs .11
HON: 1.95 vs 1.89
RF: .35 vs .31
ROP: 2.61 vs 2.49
SLB: .38 vs .38
STI: 1.29 vs 1.11
STT: 1.62 vs 1.58
SWK: 1.39 vs 1.35
SYF: .83 vs .74
WM: .91 vs .82
Key Economic Reports
None
Happy trading!
Tom
