Market Recap for Wednesday, April 18, 2018
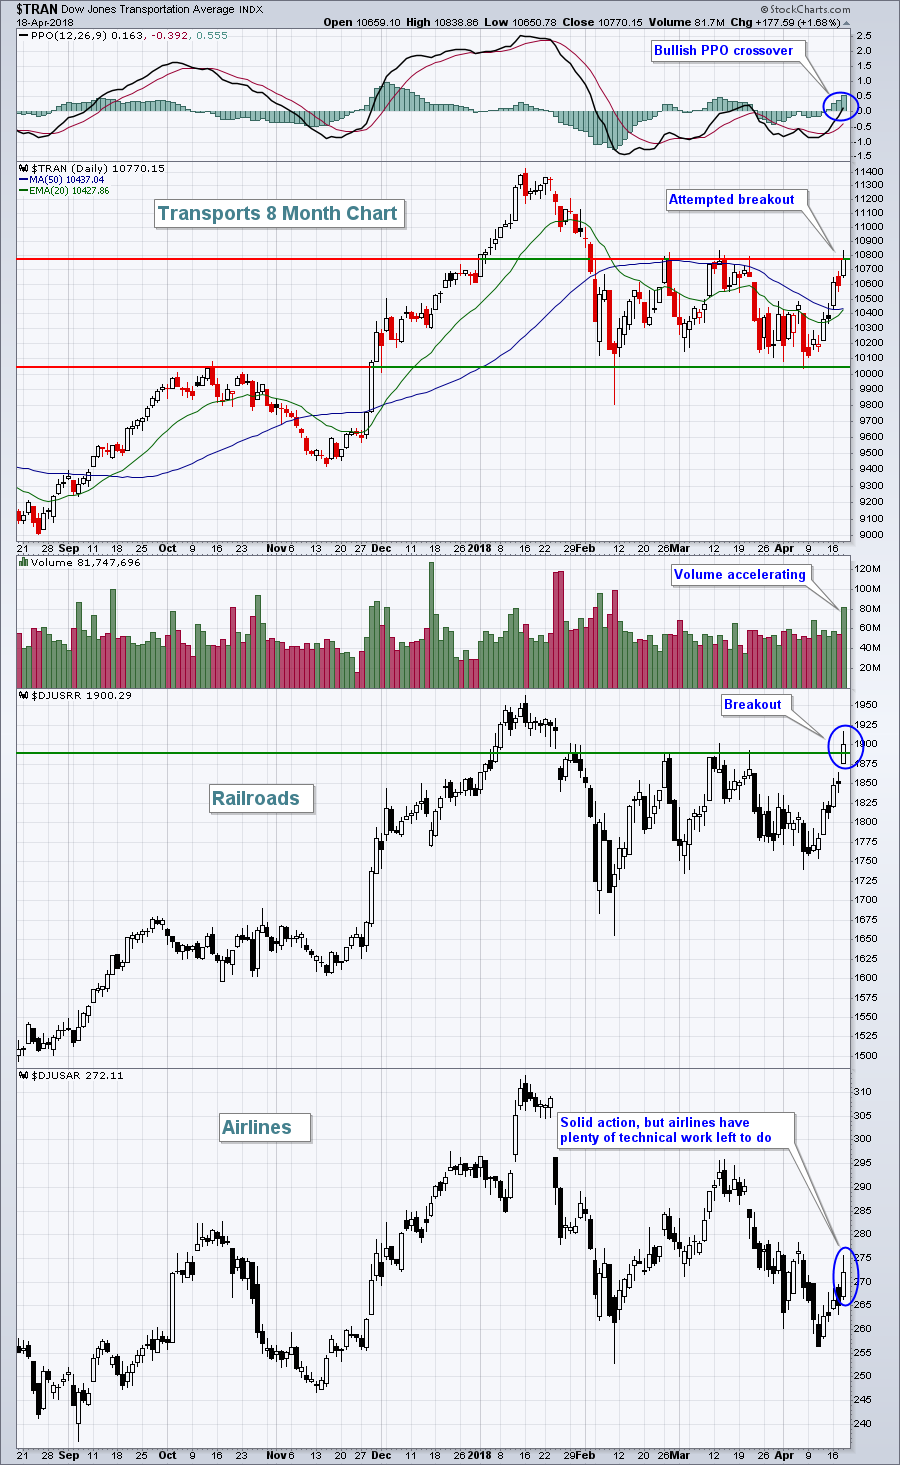
Our major indices showed signs of tiring on Wednesday as its seasonal pre-earnings run from April 1st to April 18th concluded. Five sectors managed to finish in positive territory, including the red-hot energy sector (XLE, +1.57%) and industrials (XLI, +1.04%). The latter benefited from a superb showing by transports ($TRAN) as railroads ($DJUSRR) and airlines ($DJUSAR) soared on key earnings reports:
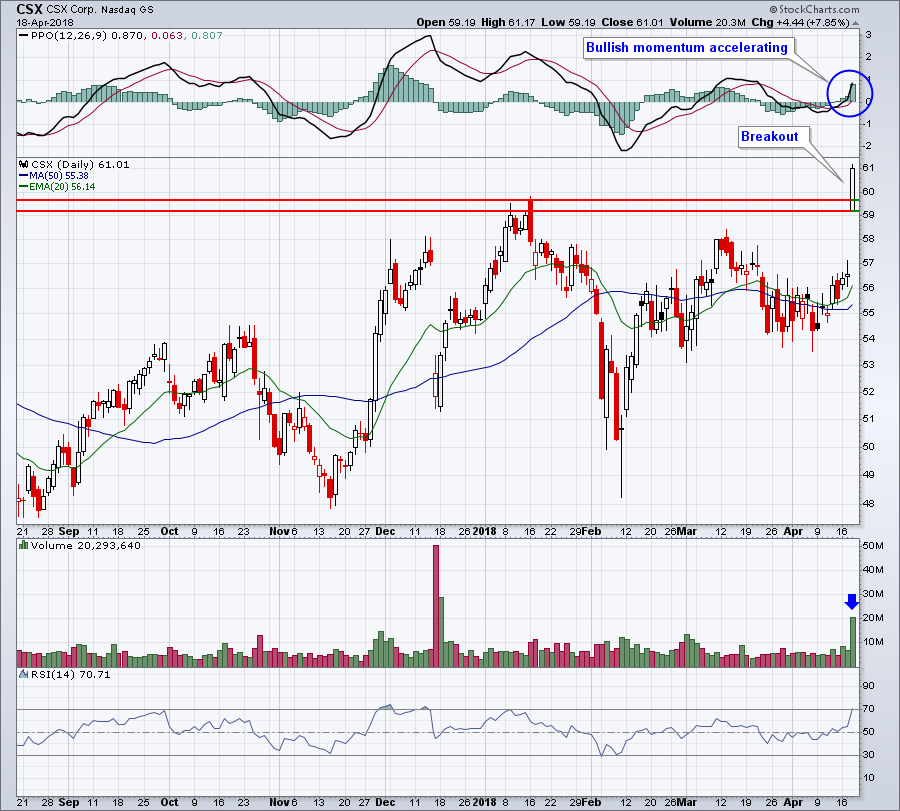
 We saw another bullish PPO crossover on the TRAN, similar to mid-March, but this time it's accompanied by much heavier volume, a sign of potential accumulation. Follow through to the upside should be respected and treated as the beginning of an uptrend. Railroads are the clear leader as the DJUSRR broke out above recent tops, thanks in large part to a very bullish reaction to CSX Corp's (CSX) solid quarterly earnings report:
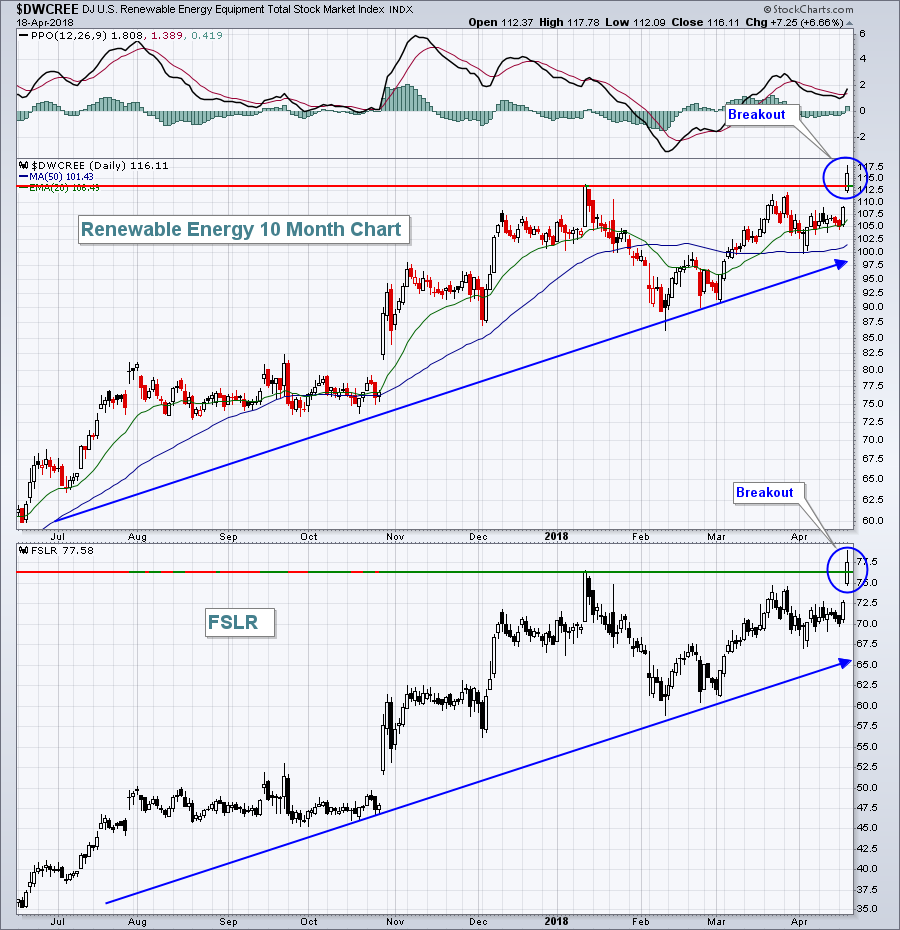
 Energy saw across-the board strength, but renewable energy stocks ($DWCREE) were particularly strong and featured below in the Sector/Industry Watch section.
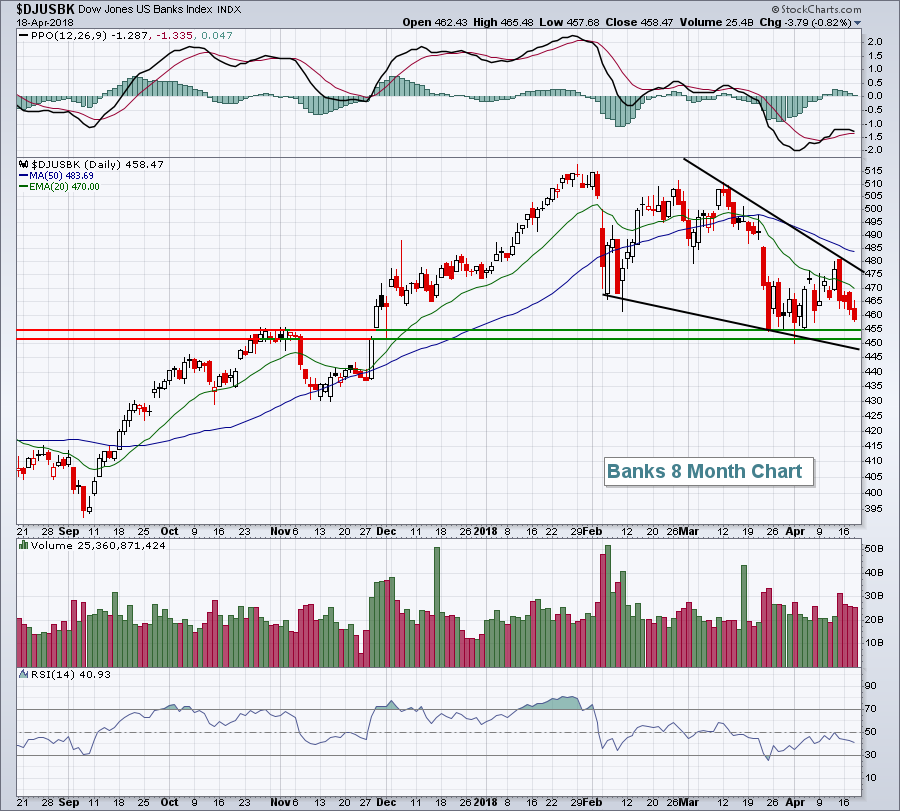
Among the not-so-good action, consumer staples (XLP, -0.75%) struggled with tobacco ($DJUSTB) and tires ($DJUSTR) leading to the downside. Financials (XLF, -0.47%) had another rough outing as banks ($DJUSBK) meander lower to approach fairly important price support. That chart is highlighted in the Current Outlook section below.
Pre-Market Action
The 10 year treasury yield ($TNX) is back on the rise, up nearly 4 basis points to 2.90% today. It is rapidly approaching its February high just below 2.95%. A breakout would be a bullish signal for equities, especially banks and other financials. Crude oil prices ($WTIC) are also very strong this morning, rising above $69 per barrel (+1.15%) and that should keep a bid under energy shares.
Gold ($GOLD) remains near $1350 per ounce. Major long-term resistance is in the $1375-$1400 per ounce range, while shorter-term resistance is closer to $1360 -$1365 per ounce.
Global markets were fairly strong overnight and into this morning, but currently U.S. futures are not following their lead. Dow Jones futures are lower by 68 points with a little more than 30 minutes left to the opening bell.
Current Outlook
Banks ($DJUSBK) are an important component in every bull market. Many companies in the U.S. are credit-dependent in order to grow earnings and history tells us that when banks begin to lag the market, it can become a serious issue for the overall market. Having audited banks for many years, my own personal experience is that as banks grow more defensive, they turn to more defensive-oriented assets vs. loans. That not only hinders bank earnings, but it squeezes the backbone of our business culture, making it difficult for companies to grow earnings. Let me be clear - I'm still very bullish. But we should all recognize that it's one bearish signal if banks begin to lose key price support levels. With that in mind, here's the DJUSBK chart currently:
 Bank profits are very tightly correlated with the direction of treasury yields. I'm a believer that the 10 year treasury yield ($TNX) will continue on its path higher, enabling the DJUSBK to eventually make a bullish break to the upside and out of the wedge pattern (black lines). The 450-455 level is important and there could be a very significant scare if 450 support is lost. An intraday loss of this support followed by an afternoon of buying and close back above this key support would be a major buy signal in my view.
Sector/Industry Watch
Renewable energy ($DWCREE) made a big move higher, clearing important price resistance in the process. It certainly didn't hurt to see First Solar (FSLR) soaring on an upgrade and positive outlook. Both of these charts show breakouts:
 Both of these charts look bullish and I'd expect to see further outperformance, especially with more money rotating into the energy sector.
Historical Tendencies
I post this frequently, but it's always worth reiterating. The 19th and 20th days of the month are easily the most bearish consecutive calendar days. Here are the annualized returns for each day on the S&P 500 and the NASDAQ:
S&P 500 (since 1950):
19th: -32.80%
20th: -5.62%
NASDAQ (since 1971):
19th: -28.48%
20th: -30.68%
I do want to point out that the stock market has risen plenty of times on both of these days, so this stat in no ways suggests a guarantee that the stock market will fall over the next two days, but the bearish tendency is there.
Key Earnings Reports
(actual vs. estimate):
ABB: .31 vs .31
BBT: .97 vs .92
BK: 1.10 vs .97
BX: .65 vs .46
DHR: .99 vs .93
GWW: 4.18 vs 3.41
KEY: .38 vs .38
NUE: 1.10 (estimate - still awaiting results)
NVS: 1.28 vs 1.25
PM: 1.00 vs .88
PPG: 1.41 (estimate - still awaiting results)
TSM: .59 vs .60
(reports after close, estimate provided):
ETFC: .79
RCI: .60
Key Economic Reports
Initial jobless claims released at 8:30am EST: 232,000 (actual) vs. 230,000 (estimate)
April Philadelphia Fed Survey released at 8:30am EST: 23.2 (actual) vs. 20.1 (estimate)
March leading indicators to be released at 10:00am EST: +0.3% (estimate)
Happy trading!
Tom
