Special Note
I typically post a blog article every day that the U.S. stock market is open. If you'd like to receive my blog articles as soon as they're published, you can subscribe (for FREE) by scrolling to the bottom of this article, typing your email address and clicking the "Subscribe" button.
And if you ever have any comments on my articles, feel free to send me an email at "tomb@stockcharts.com".
Thank you!
Market Recap for Tuesday, April 3, 2018
Everyone is talking about a trade war and how that might impact the U.S. markets going forward. Honestly, at this point, I'm much more concerned about the Volatility War that's been taking place the past couple months. Blame the high volatility on the topic du jour, but it's the volatility itself that is ruling the stock market currently. High volatility means an emotional stock market and one that has knee jerk reactions to news, rumors and innuendos. It's what we're dealing with right now and no amount of technical analysis will wash it away. It'll simply take time - more than I was anticipating for sure.
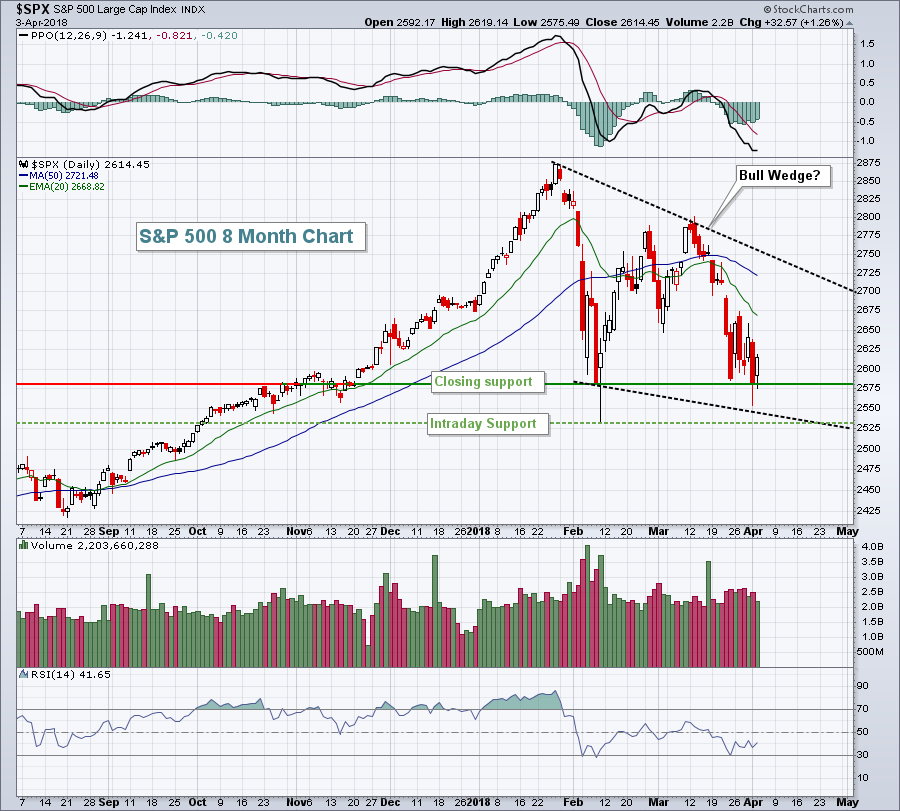
On February 2nd, the Volatility Index ($VIX) closed above 17 for the first time since the presidential election in November 2016. That initial surge in the VIX culminated with the S&P 500 dropping to a close of 2581 on February 8th. Monday's close of 2581.88 printed a double bottom, but futures this morning are extremely weak again with more China tariffs announced on U.S. products. If you're in the intermediate- to longer-term bullish camp like me, it's looking more and more like a potential bullish wedge developing, especially if we do close today beneath that February 8th low:
 Several weeks ago, after the VIX initially surged, I suggested that we'd see a bullish continuation pattern emerge. The problem is, it's difficult to know which pattern it will be. And, of course, I could be completely wrong and perhaps we've topped long-term. I don't believe that's the case for reasons I've discussed in this blog previously.
Tuesday's rebound was nice, although technology (XLK, +0.99%) did struggle on a relative basis. Energy (XLE, +2.13%) was the best performing sector as it once again bounced off 66 support. Because of the number of times we've seen 66 support hold, I'd conclude that is a major level of support.
Pre-Market Action
We're setting up for an across-the-board violent selloff this morning that shows Dow Jones futures down more than 500 points with about 40 minutes left to the opening bell. The Hang Seng Index ($HSI) fell over 660 points (-2.19%) last night and there's been more than a 1% drop in Germany's DAX ($DAX) this morning.
The fear that's gripping the market is trumping the solid economic and earnings news out this morning. ADP employment for March showed much stronger job growth than expected, 241,000 vs 185,000. Also, Lennar Corp (LEN) printed a potential triple bottom yesterday before announcing a huge earnings beat this morning, 1.11 vs .92. None of that matters in a volatile environment, so until we see the VIX begin to settle down, expect more of the same market swings - in both directions. The bears definitely have the short-term advantage, at least until we see a big reversal in the VIX.
Current Outlook
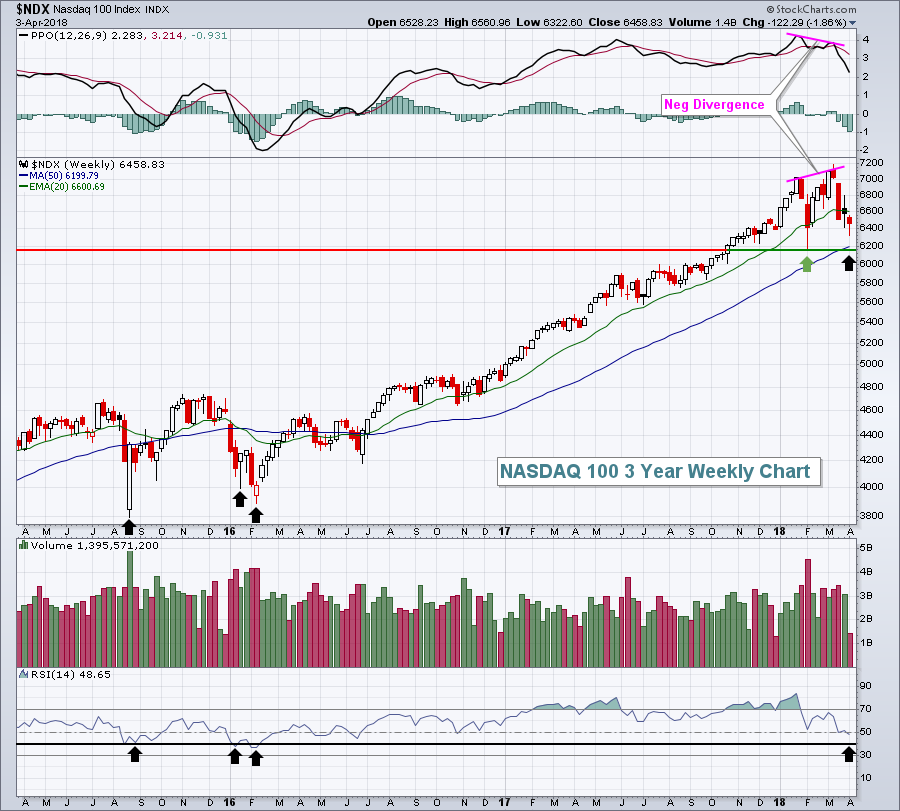
Odds are now growing that the NASDAQ and NASDAQ 100 could be on a collision course with their respective 50 week SMAs. A double bottom on these aggressive indices would also accomplish a potential PPO centerline reset, along with a 50 week SMA test. Here's the NASDAQ 100 ($NDX) view:
 The weekly PPO and RSI have both fallen to their lowest levels in more than a year. The black arrows highlight RSI trips into that 40-50 support zone (and slight dip beneath in February 2016). A continuing drop to at least test that rising 50 week SMA now appears to be much more likely given the renewed selling this week and the red futures this morning.
Sector/Industry Watch
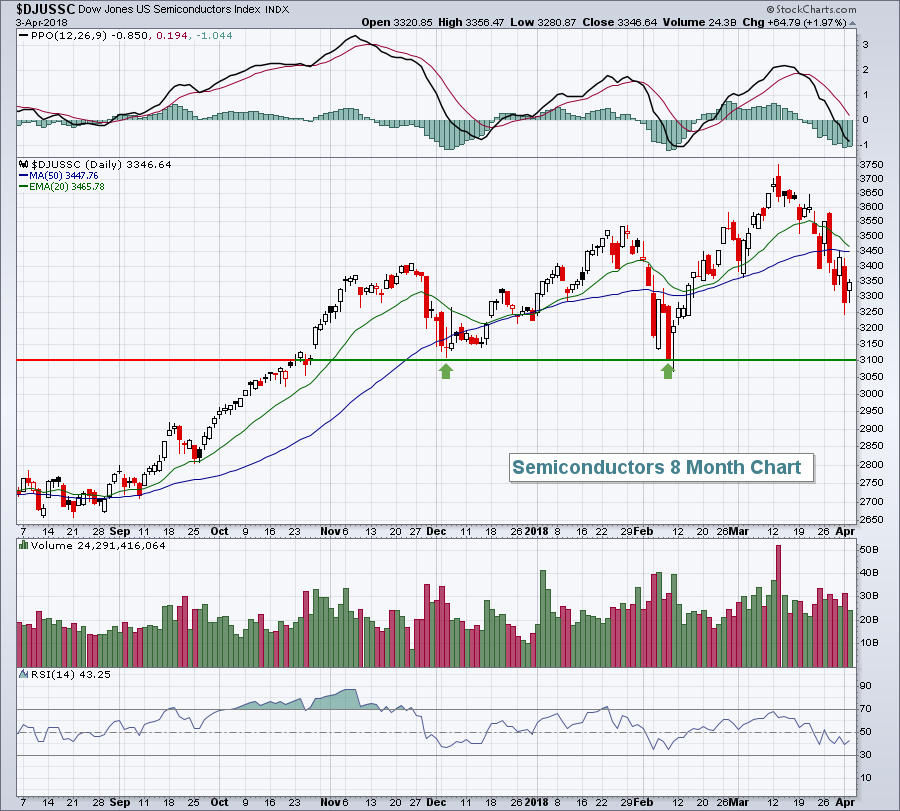
The Dow Jones U.S. Semiconductor Index ($DJUSSC) rebounded on Tuesday, but still appears to be subject to more selling down to support near 3100:
 The DJUSSC is trading beneath its declining 20 day EMA so that's the resistance to keep an eye on. In the meantime, if volatility remains high, a test of support near 3100 would appear imminent. That would likely coincide with the NDX testing its 50 week SMA mentioned above in the Current Outlook section.
Historical Tendencies
Yesterday, I pointed out that the Russell 2000 tends to perform much better during the 2nd half of April. That's not the case with the S&P 500 (since 1950) as you can see below:
April 1-15: +21.84%
April 16-30: +14.17%
Most of the second half strength in April comes from April 16th through 18th. If we ignore those three days, the second half of April performance falls to +3.26%.
Key Earnings Reports
(actual vs. estimate):
LEN: 1.11 vs .92
KMX: .77 vs .89
Key Economic Reports
March ADP employment report released at 8:15am EST: 241,000 (actual) vs. 185,000 (estimate)
March PMI services index to be released at 9:45am EST: 54.1 (estimate)
February factory orders to be released at 10:00am EST: +1.7% (estimate)
March ISM non-manufacturing index to be released at 10:00am EST: 59.0 (estimate)
Happy trading!
Tom
