Market Recap for Thursday, January 25, 2018
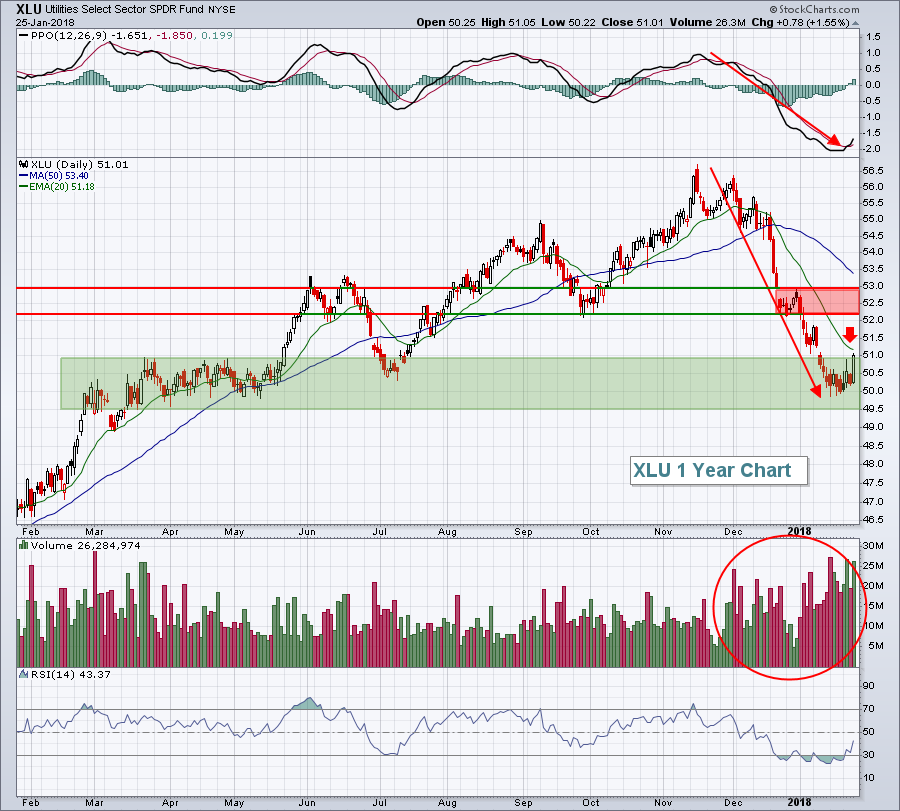
Utilities (XLU, +1.55%) easily enjoyed its best day of 2018 on Thursday as significant price support, combined with falling treasury yields, triggered an explosive move higher as buyers could not get enough of the beaten-down sector. Here's the chart:
 The green shaded area provided the support and encouragement the bulls needed to make a stand and yesterday's move higher was accompanied by excellent volume. So we definitely want to respect the 49.50-50.50 area as a major price support zone. To the upside, I'm watching two key areas of resistance. The first is the declining 20 day EMA (red arrow). Should we pierce that moving average, look to an overhead price resistance zone from 52.25-53.00 that includes "prior support turned resistance" and the top of gap resistance closer to 53.00.
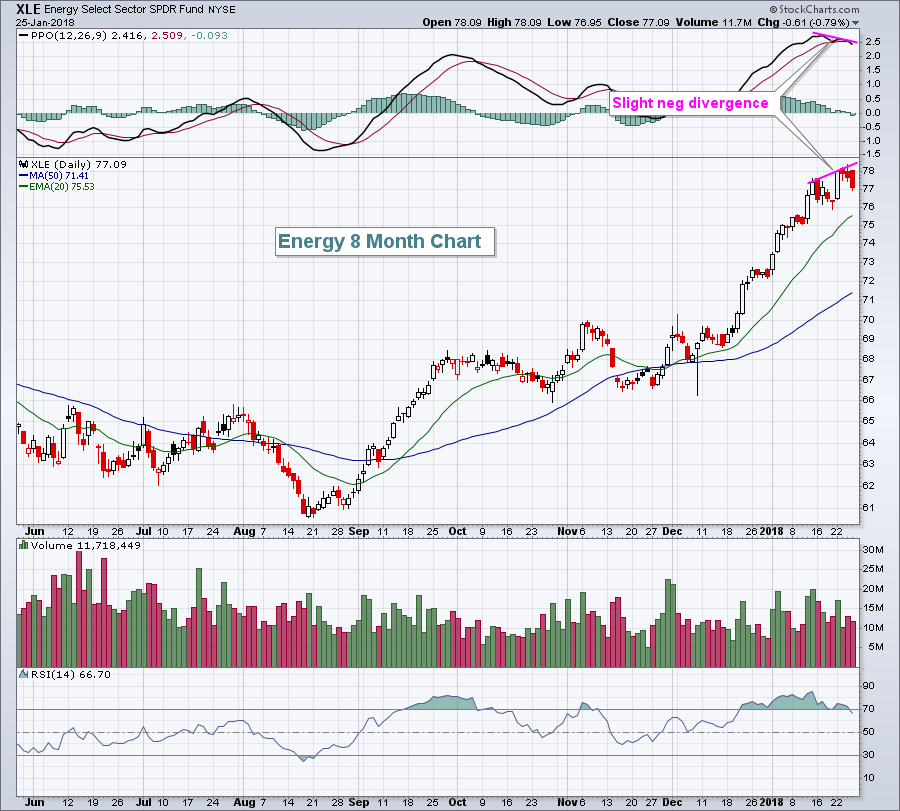
Energy (XLE, -0.79%) was the clear laggard on the session despite new intraday highs being set in crude oil prices ($WTIC). The WTIC did reverse and finish slightly lower on the session to accompany the lower energy shares:
 Normally, I'd look for an extended period of consolidation, or even selling, after a negative divergence prints. However, a raging bull market doesn't always follow the rules we're accustomed to - just take a look at the overbought momentum oscillators on our major indices for proof. But it is worthwhile to at least note the slowing momentum present here and to take necessary precautions (tighter stops, trade smaller positions, etc) to help to minimize risk associated with the sector.
The Dow Jones was able to close at another record high, thanks in part to very strong earnings reports from 3M (MMM) and Caterpillar (CAT), two Dow components.
Pre-Market Action
A blowout report by Intel (INTC) last night after the closing bell has sent its shares higher by more than 6% in pre-market trade this morning. That is clearly having an impact on both Dow Jones and NASDAQ 100 futures as INTC is represented in both indices.
First quarter GDP came in below expectations (+2.6% vs +2.9%), but that has had little impact on stock futures as Dow Jones futures are higher by 37 points. NASDAQ futures are up a much higher percentage.
Current Outlook
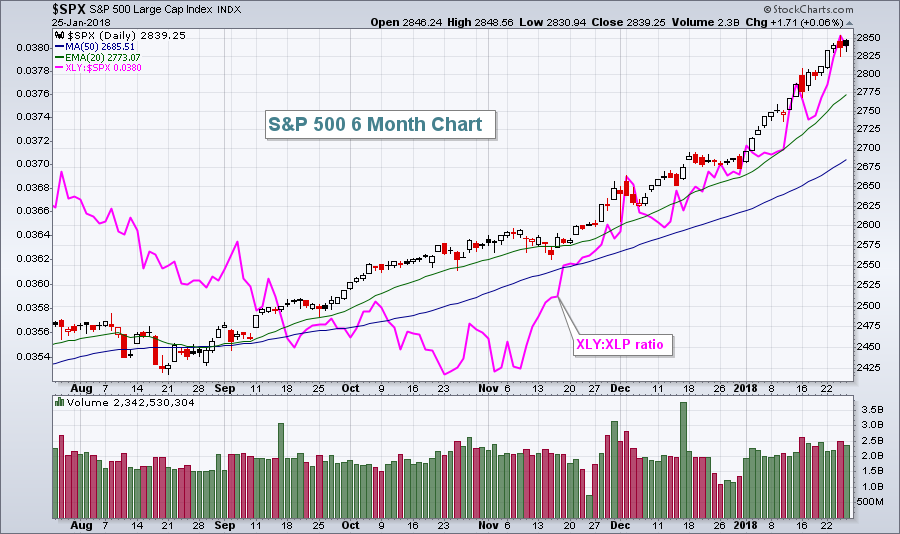
While we've seen a couple of price cracks recently in the major indices, my primary indicator of underlying strength in the market - the discretionary to staples ratio (XLY:XLP) - continues surging to new highs, thus supporting the stock rally. It's very difficult for me to grow bearish - other than expecting a normal profit taking pullback at some point to test rising 20 day EMAs. Check out the S&P 500 with an XLY:XLP ratio overlay:
 Based on this chart alone, the current bull market remains very solid technically and is certainly supported by the action in consumer stocks.
Sector/Industry Watch
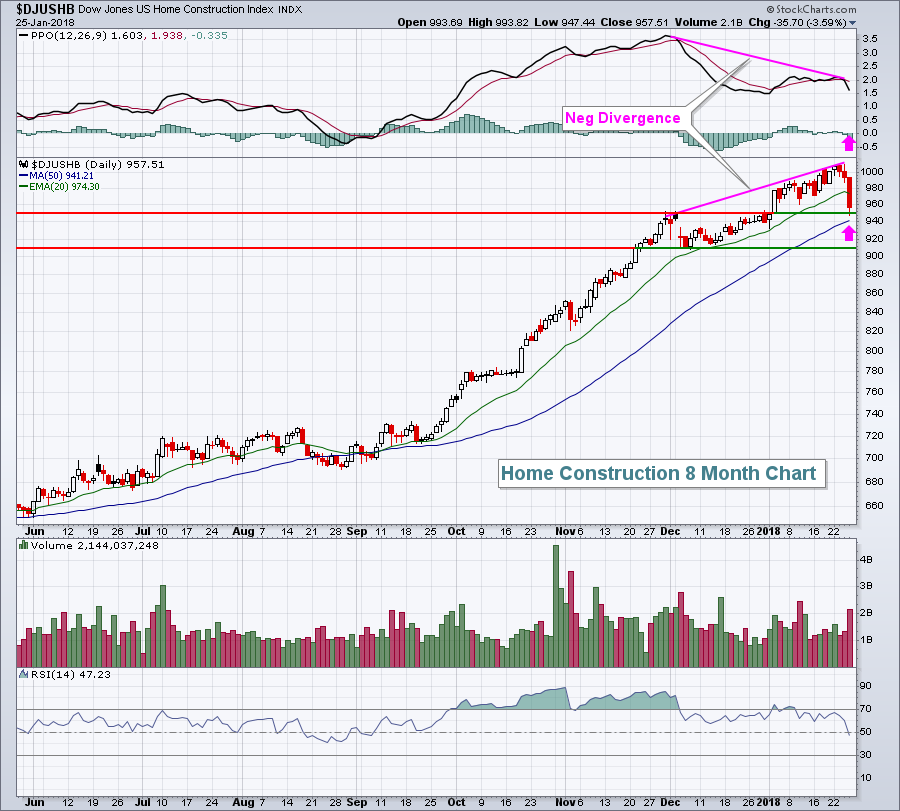
The December new home sales report was released on Thursday and the number came in well below expectations, triggering a rather large selloff in homebuilders ($DJUSHB). There is a negative divergence in place on the PPO so selling down to at least 50 day SMA support should be considered normal profit taking:
 Note that the RSI has fallen back into the 40s. The last time the RSI hit 40 was in late August, just prior to the huge move higher in the group. If the DJUSHB fails to hold above its 50 day SMA, the previous lows near 910 could come into play. That, combined with an RSI 40, would likely set up very solid reward to risk trades in this industry group.
Historical Tendencies
Fridays have historically been a very solid day for the U.S. stock market. While the S&P 500 has risen 53.34% of all trading days since 1950, Fridays have risen approximately 56.5% of the time and have produced annualized returns that are nearly double that of the S&P 500.
Key Earnings Reports
(actual vs. estimate):
ABBV: 1.48 vs 1.44
APD: 1.79 vs 1.66
CL: .75 vs .75
COL: 1.59 vs 1.53
HON: 1.85 vs 1.84
LEA: 4.38 vs 4.25
NEE: 1.25 vs 1.31
Key Economic Reports
December durable goods released at 8:30am EST: +2.9% (actual) vs. +0.6% (estimate)
December durable goods ex-transports released at 8:30am EST: +0.6% (actual) vs. +0.6% (estimate)
Q1 GDP released at 8:30am EST: +2.6% (actual) vs. +2.9% (estimate)
Happy trading!
Tom
