Market Recap for Friday, January 26, 2018
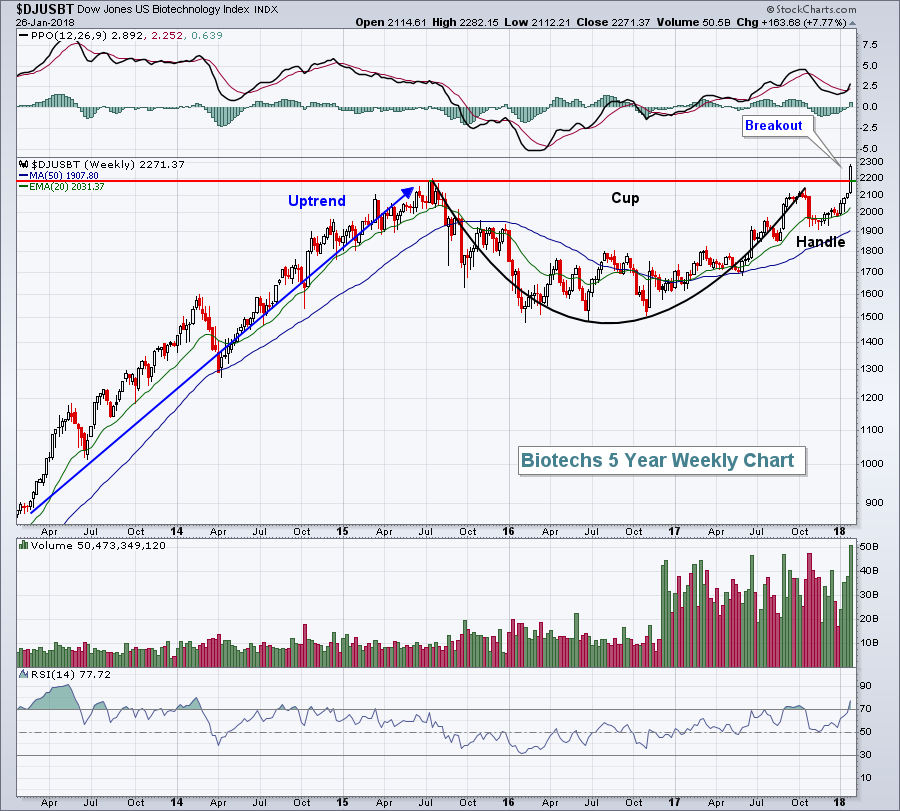
The bears were absolutely stymied on Friday as the major indices surged to unprecedented levels. Despite the very overbought conditions that have persisted on many indices for four months now, bulls dominated the action and show no signs of letting up. When you see a rally like the one we saw on Friday, it's bullish. But it's particularly bullish when you witness the type of leadership we saw. While the defensive-oriented healthcare sector (XLV, +2.15%) led the rally, the strength within that space came from biotechnology ($DJUSBT, +4.26%), which is the most aggressive area within healthcare. The rally in biotechs cleared extremely important multi-year price resistance that suggests this rally remains in the early stages. Check out the chart:
 The depth of the cup is 700 points. The measurement of this pattern equals the breakout level plus the depth of the cup. This cup with handle breakout suggests an eventual target of 2900, a very exciting development for traders and long-term investors alike.
It wasn't just biotechs and healthcare that led the market higher on Friday, though. Technology (XLK, +1.59%), industrials (XLI, +1.15%), consumer discretionary (XLY, +0.98%) and financials (XLF, +0.73%) finished in order behind healthcare on the sector leaderboard. These are the four aggressive sectors and, when the market is surging like it did on Friday, these are the sectors we want to see lead the action. It suggests this bull market rally is quite sustainable as traders are welcoming risk.
Pre-Market Action
There was a bit of profit taking in Asian markets overnight, while Europe is mixed this morning. The 10 year treasury yield ($TNX) has surged another 5 basis points above 2.70% and that should help the financial sector (XLY) today, but will likely pressure utilities (XLU).
With approximately 45 minutes left to the opening bell, Dow Jones futures are down 47 points.
Current Outlook
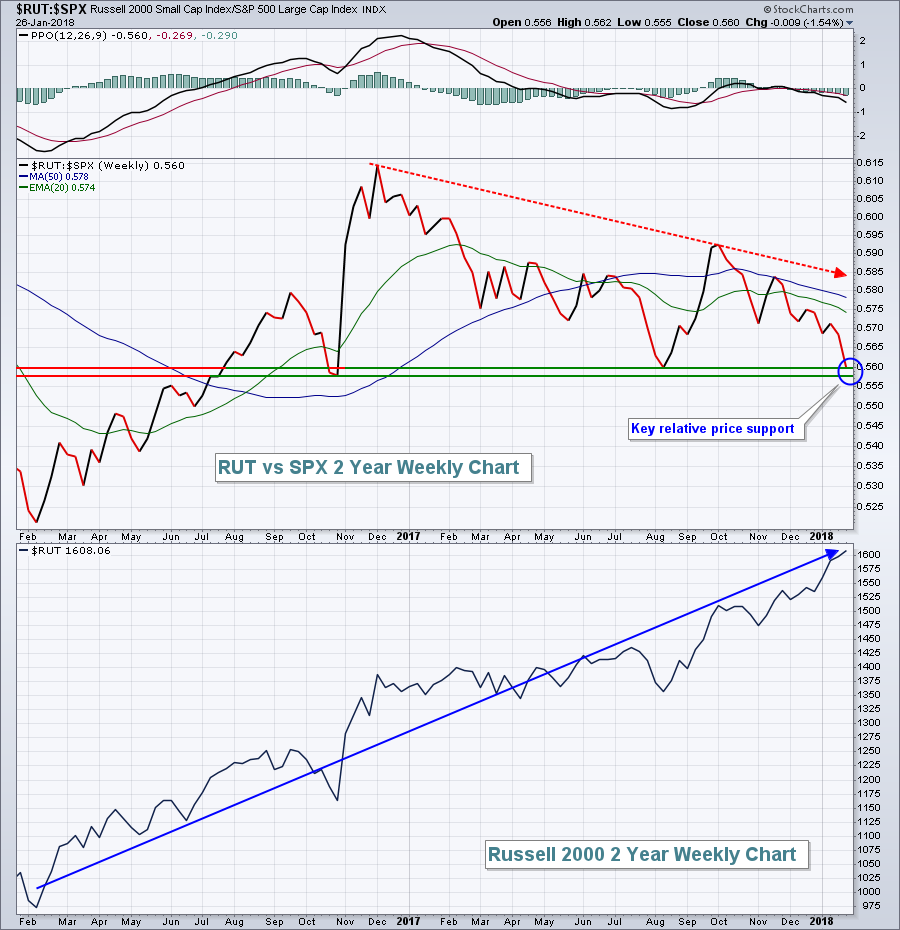
If there's been one disappointing part of this bull market rally, it's been the relative performance of small cap stocks. They've participated for sure, rising to all-time high record closes nearly every day it seems. But their performance, relative to the benchmark S&P 500, has been a major disappointment. The good news? They're closing in on a very significant level of relative price support:
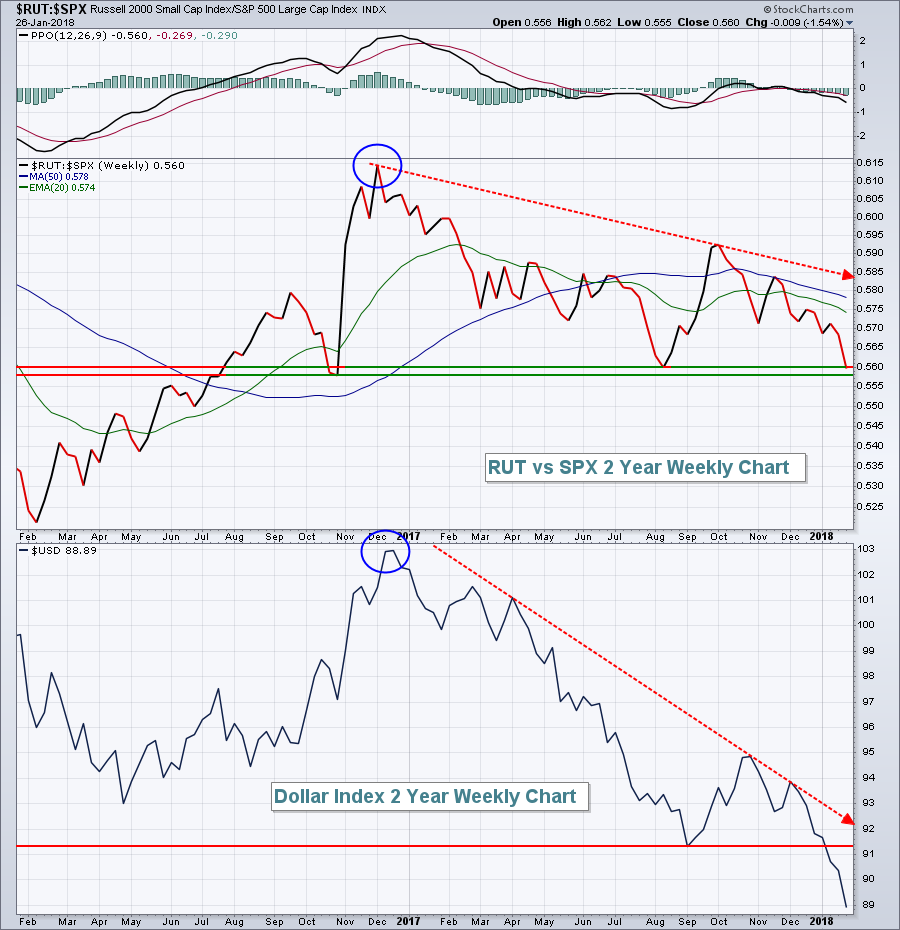
 There are likely several reasons for the relative underperformance, but one big reason is the weakness in the U.S. Dollar Index ($USD). A falling dollar results in positive foreign currency translations for multinational companies listed on the Dow Jones and S&P 500....and the dollar index has been struggling. Check it out in the Sector/Industry Watch section below.
Sector/Industry Watch
The rapidly declining U.S. Dollar Index ($USD) has its positives and negatives. It's no doubt helping the bottom lines of multinational companies found on the Dow Jones and S&P 500. It also is helping many of the large cap NASDAQ stocks. But it doesn't help those companies that do most or all of their business on American soil...or the small cap Russell 2000 companies ($RUT). While the U.S. economy is strengthening, and while the U.S. stock market is suggesting that strength will continue, I expect the Russell 2000 to rise. But it will have difficulty rising faster than its larger cap index counterparts unless the U.S. dollar finds a bottom. Here's a perfect illustration of the relative headwinds that small caps have been facing:
 As the USD topped in December 2016, so did the relative strength of the Russell 2000 (blue circles). While the small cap index's relative strength doesn't always follow the lead of the USD, the dollar's performance is certainly influential in which area of the market that traders want to invest. They've made their votes clear over the past 14 months.
Monday Setups
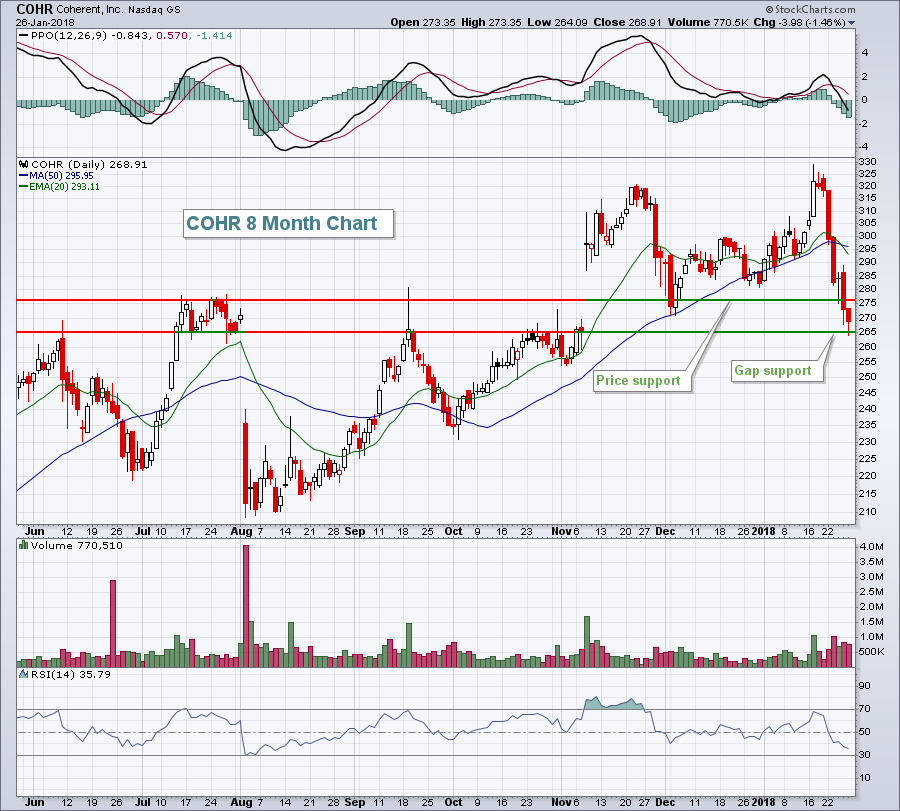
Every Monday I provide potential trade setups where stocks look interesting to me from a technical perspective. You can CLICK HERE to look at this week's and prior weeks' setups. For this week, Coherent, Inc. (COHR) looks interesting. It's been sold off hard for the past several trading days, but has now reached a very critical area of support. With its earnings report just a couple weeks away, there's a reasonable chance we'll see buying heading into that report. Here's the chart:
 COHR was breaking out to new highs just a couple of weeks ago and now its has an RSI reading at 36. Given that gap support is now at hand, it's time to see a reversal or simply to avoid. The reward to risk on entry at this level seems solid to me.
Historical Tendencies
Since 1950, the S&P 500 has produced annualized returns of +1.33% and +14.58% during the calendar months of February and March, respectively.
Key Earnings Reports
(actual vs. estimate):
AMG: 4.68 vs 4.55
D: .91 vs .88
LMT: 4.30 vs 4.06
STX: 1.48 vs 1.40
(reports after close, estimate provided):
ARE: 1.54
PFG: 1.37
Key Economic Reports
December personal income released at 8:30am EST: +0.4% (actual) vs. +0.3% (estimate)
December personal spending released at 8:30am EST: +0.4% (actual) vs. +0.5% (estimate)
Happy trading!
Tom
