Market Recap for Monday, August 7, 2017
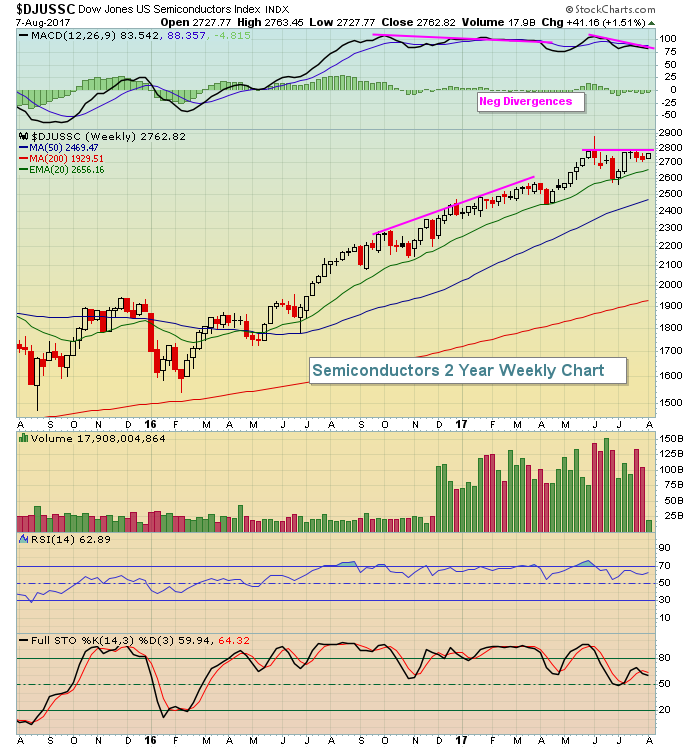
There's nothing wrong with the Dow Jones moving to all-time highs for the ninth consecutive trading session. However, higher prices on the more aggressive NASDAQ and Russell 2000 show traders' appetite for riskier investments and it's that risk element that helps to fuel bull markets. On Monday, traders returned to the more aggressive NASDAQ 100 ($NDX) stocks. In fact, the top three stocks in the NDX yesterday (and four of the top five) were semiconductor stocks ($DJUSSC). The DJUSSC remains very solid on its daily chart, but the weekly negative divergence persists. And let's not forget that the DJUSSC has averaged losing 5% during the month of September over the past couple decades. So will this latest strength be the group's last for awhile? We'll soon find out, but here's the chart to be aware of:
 In all fairness, divergences do not always work as a leading indicator. It is, after all, calculated using past data so it's signal is lagging in nature. But these negative divergences, in many instances, do provide advanced warnings and I'd at least be on my toes if the 20 week EMA is lost. There's currently almost 200 points between the 20 week and 50 week moving averages. Losing the former would likely result in a test of the latter. Stay on your toes, especially given that very poor seasonal performance in September for the DJUSSC.
Consumer staples (XLP, +0.75%) led the action on Monday, while energy (XLE, -0.76%) slumped once again as it falls further and further from key price resistance at 67.00.
On the NASDAQ 100 (post-Apple's earnings report), the key opening price was 5934. Yesterday's close was 5934. Futures are weak this morning so we're likely going to see a gap down. However, a move above 5934 on the NDX would be a bullish signal for sure and likely lead to an all-time high test closer to 6000.
Pre-Market Action
Dow Jones futures are pointing to a slightly lower open. Crude oil ($WTIC) is holding steady just beneath the $50 per barrel level, while gold ($GOLD) looks to bounce off its rising 20 day EMA after a few days of profit taking. Asian markets were mixed overnight, but European markets are selling in unison, albeit fractionally.
Current Outlook
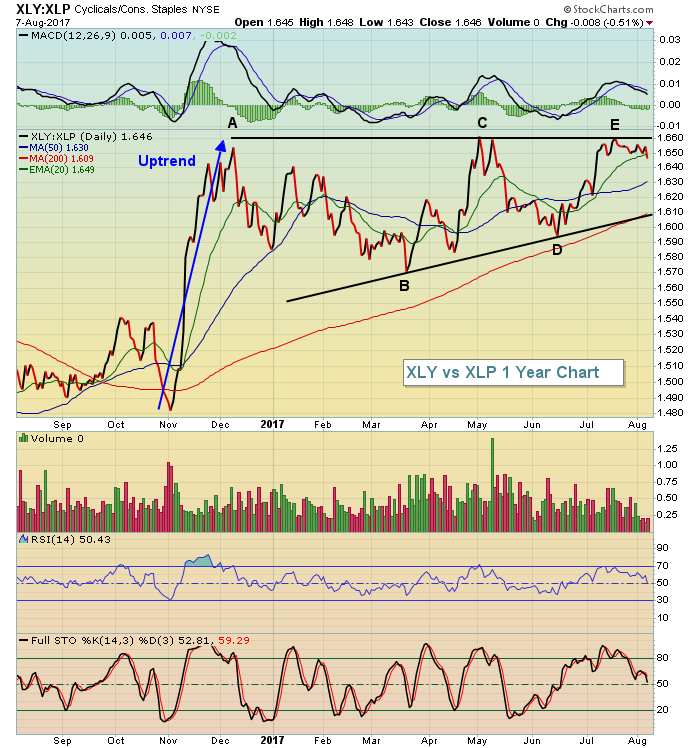
We haven't been hearing a lot about consumer stocks, but the consumer discretionary vs. consumer staples ratio (XLY:XLP) has quietly been consolidating in a very bullish relative triangle. A breakout would represent one solid argument that this bull market is absolutely sustainable. Have a look:
 During my years of following the U.S. stock market and based on many years of research, I find the XLY:XLP relationship to be one of the strongest correlations to the directional sustainability of the benchmark S&P 500. While I do believe the S&P 500 could correct - or at least consolidate - over the next couple months, I do not expect a major market top. I see higher prices ahead for U.S. equities as we roll toward year end and into 2018.
Sector/Industry Watch
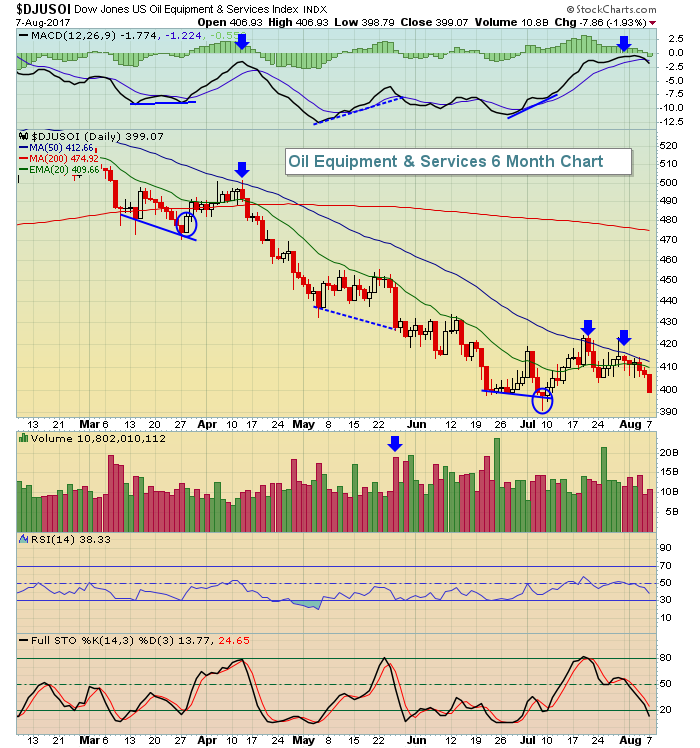
The Dow Jones U.S. Oil Equipment & Services Index ($DJUSOI) is a perfect example of how divergences work. Some try to use divergences as a major long-term topping or bottoming signal. Personally, using divergences for that type of technical analysis is premature in my opinion. It's a sign of slowing price momentum, which generally needs to be rectified, but it's not always a sign of a major impending reversal. Take a look at the DJUSOI chart:
 Over the past six months, we've seen the DJUSOI test the 50 day SMA overhead resistance twice. In both instances, there was a positive divergence that preceded that short-term strength. Blue arrows mark those 50 day SMA tests, along with return trips to or near the MACD centerline. Once that slowing downside momentum was resolved with 50 day SMA tests, the prior trend continued. These divergences did not mark a reversal in the trend, only a bit more temporary relief from the selling. Divergences can mark major bottoms, but they don't always. Sometimes, it provides the bulls just a bit more relief before the heavy selling resumes. Note yesterday's red-filled candle and return trip to the early July low. With the MACD now turning lower once again, a breakdown beneath 390 should be viewed quite bearishly.
One last point. I highlighted a positive divergence in late May with blue dotted lines. That divergence didn't work and one reason why is that there honestly wasn't slowing momentum. Volume accelerated on that price break below support and it certainly wasn't a reversing candle. The last divergence, on the other hand, printed with a reversing hammer candlestick. I would grow more bullish near-term with the combination of a positive divergence and a reversing candlestick.
Historical Tendencies
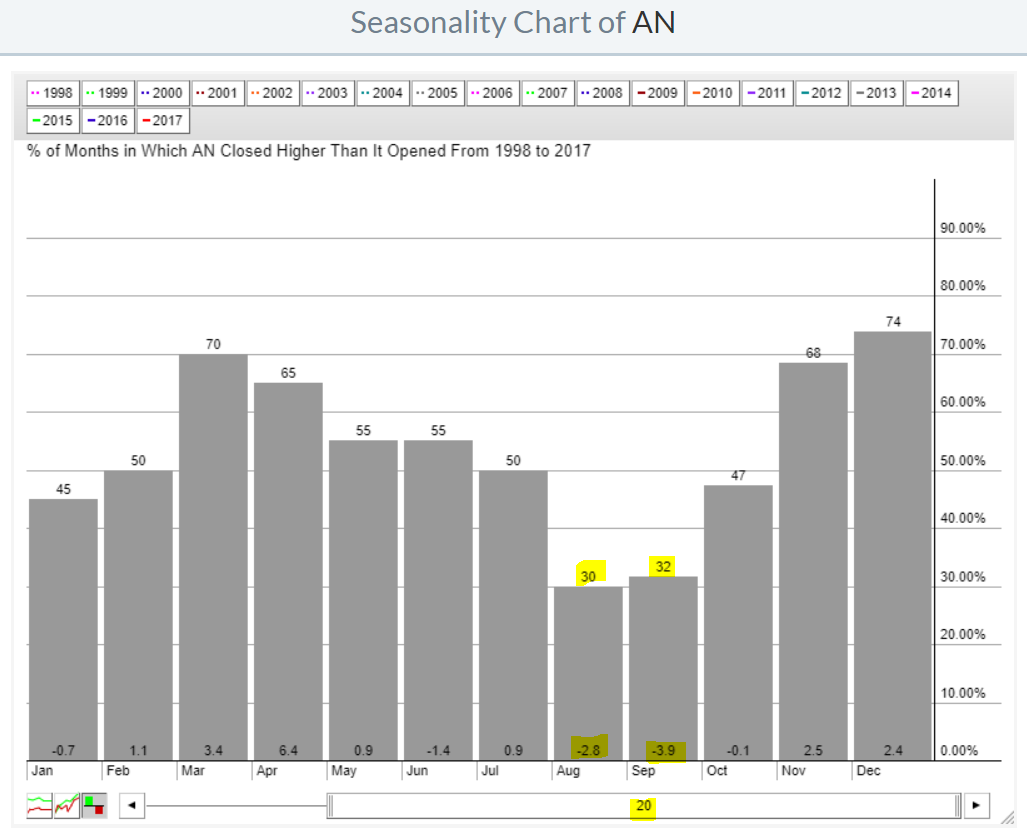
Autonation (AN) has been mired in a multiyear funk and if seasonality has anything to say, AN won't be bouncing any time soon. August and September have proven to be very difficult months for AN over the past couple decades and this August has already started off on the wrong foot. The seasonality chart below doesn't offer up much short-term hope:
 Several calendar months produce excellent average returns, but none of those months are named August or September. Buckle up if you're long.
Key Earnings Reports
(actual vs. estimate):
CVS: 1.33 vs 1.31
HSIC: 1.75 vs 1.73
TDG: 3.20 vs 2.98
ZTS: .53 vs .53
(reports after close, estimate provided):
DIS: 1.53
DXC: 1.25
MNST: .40
PCLN: 14.27
Key Economic Reports
None
Happy trading!
Tom
