Reminder
If you'd like to receive my blog article each trading day, just as it's published, be sure to scroll down to the bottom of this article, type in your e-mail address and click the "Notify Me" button. It's FREE and you can unsubscribe at any time. :-)
Market Recap for Tuesday, August 8, 2017
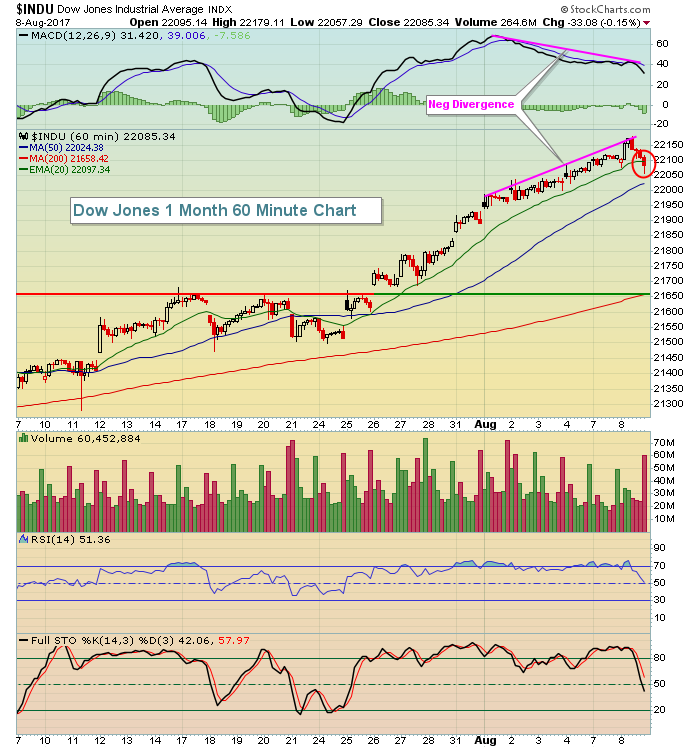
On the surface, it was just a simple day of profit taking. But I think it will end up being much more than that. The Dow Jones winning streak finally ended. Not only had the Dow Jones finished with record high closes for the past nine trading sessions, but it also printed higher lows each of those days. That streak ended as well with the Dow Jones struggling all afternoon on Tuesday as you can see below:
 The afternoon selling resulted in the first crack of support on the Dow Jones as the rising 20 hour EMA was violated into the close. I would expect to see more selling down to test the recent breakout close to 21650.
There weren't any huge losses on the session. The biggest technical issue with the selling was that it occurred after several key breakouts were in hand. The NASDAQ and NASDAQ 100 had climbed back above key short-term price resistance (their opening highs after Apple's quarterly earnings report last week). They were set to advance further to test all-time high closes, but it never materialized as the sellers took control into the close.
The Russell 2000 had climbed back above its now-declining 20 day EMA. But that too was a failure, compounding the already bearish MACD centerline crossover. Key price support on the Russell 2000 resides near 1400 and the index finished yesterday at 1410 so there's not a lot of wiggle room.
Pre-Market Action
The 10 year treasury yield ($TNX) is tumbling this morning, down 6 basis points to 2.21% and gold ($GOLD) is on the move higher as fear pushes market participants into more defensive areas. Asia lost ground overnight and European markets are spooked this morning with the German DAX ($DAX) down 1.40%. Dow Jones futures look to start off weak, currently down 31 points. NASDAQ futures are down much more heavily and will likely open just above a key 20 day EMA test.
Today should be very interesting indeed. The Volatility Index ($VIX) closed at its highest level in a month yesterday, despite the S&P 500 trading at an all-time high intraday. That's a signal of growing nervousness and the increasing probability of further weakness ahead.
Current Outlook
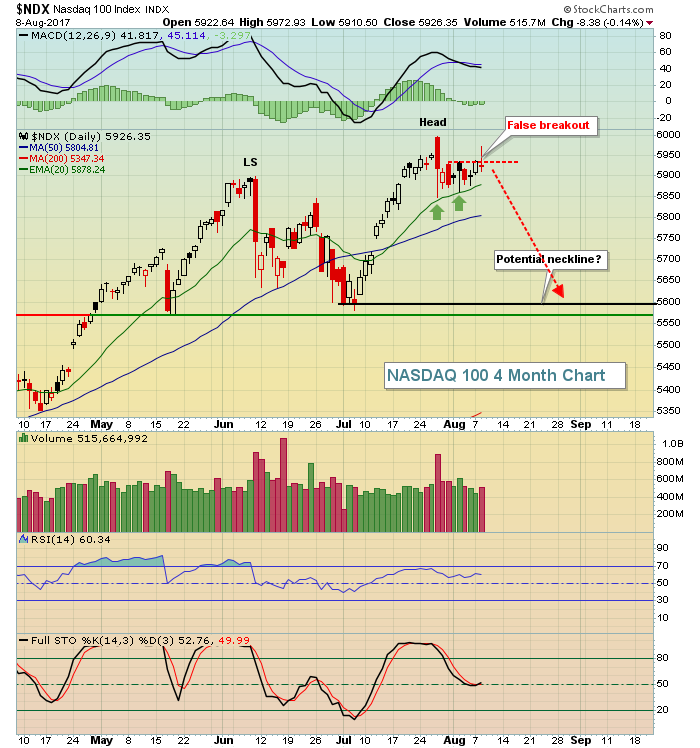
Yesterday afternoon's action was not good if you're in the bulls camp. There were key reversals everywhere and when you're in the midst of the seasonally slow summer months with weekly negative divergences in play, the writing is on the wall. Be cautious. Let's start with the NASDAQ 100 ($NDX), where yesterday I wrote that 5935 was a significant short-term resistance level. We broke it intraday only to see that breakout fail miserably by session end. Check it out:
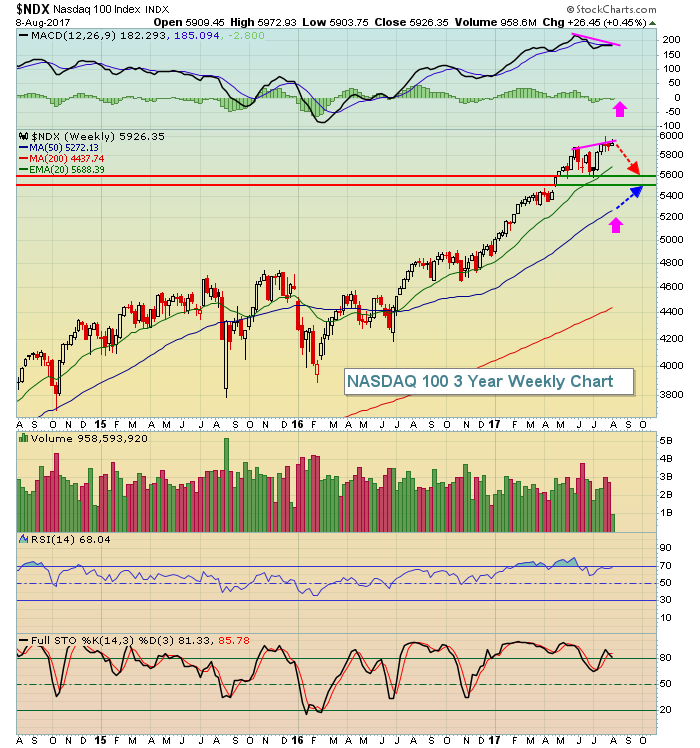
 This does not look good to me. Futures are weak this morning and I believe we're heading for a rising 20 day EMA test on the NDX - at a minimum. The bullish case is that it holds. If it doesn't, the third round of summer fireworks could be underway. I've shown a potential trip down to the 5600 level, which may seem like a lot, but weekly negative divergences typically result in 50 week SMA tests and it would make seasonal sense to see that weakness over the next 4-6 weeks. Below is the NDX weekly chart showing the possibility of more weakness ahead:
 The 50 week SMA will continue rising this summer so expect price weakness and the rising 50 week SMA to meet somewhere in the middle. I won't be shocked if price action actually moves beneath this moving average at some point to really shake things up. But I don't expect this to be the start of a bear market. In fact, I see fresh highs coming in the fourth quarter.
Sector/Industry Watch
If we really do see weakness over the next several weeks, be very careful with internet stocks ($DJUSNS). We've seen a major rise in this group off the November 2016 low (30%+) and they too have a weekly negative divergence. Given the fact that their 50 week SMA is another 12%-13% below the current index value, please understand the risks associated with stocks in this space. Here's the chart:
 We've had a few significant bouts of profit taking the past few years in this space and it's typically begun with weekly RSI being overbought and the weekly MACD rolling over. At the most recent high? Check. Check.
Also, August joins January and February as the only three months historically where we've seen the DJUSNS average negative returns. August is the second worst calendar month of the year, averaging a loss of 1.3% over the past 17 years. The good news? September and October are the two best consecutive months for internet stocks. So once we get past the next few weeks, the historical skies will turn much bluer.
A few internet names that seem particularly vulnerable from a technical perspective are InterActiveCorp (IAC), Blucora (BCOR) and NetEase.com (NTES). Others like Facebook (FB) are extended and could certainly use a pullback, but longer-term their charts remain quite solid.
Historical Tendencies
The 9th calendar day of the month has produced heavy annualized losses on the S&P 500 since 1950 and trails only the 19th calendar day of the month in terms of bearish daily performance. The reason? It's likely due to the fact that money flows arrive early in calendar months and the 9th just happens to fall shortly after that period and it's typical to see profit taking in the market during the early parts of a calendar month's second week.
Key Earnings Reports
(actual vs. estimate):
MYL: 1.10 vs 1.19
NVO: .56 (est)
WB: .33 vs .31
XRAY: .65 vs .66
(reports after close, estimate provided):
FOXA: .34
MFC: .41
NTES: 4.07
SLF: .74
Key Economic Reports
Q2 productivity released at 8:30am EST: +0.9% (actual) vs. +0.8% (estimate)
June wholesale trade to be released at 10:00am EST: +0.6% (estimate)
Happy trading!
Tom
