Market Recap for Monday, May 15, 2017
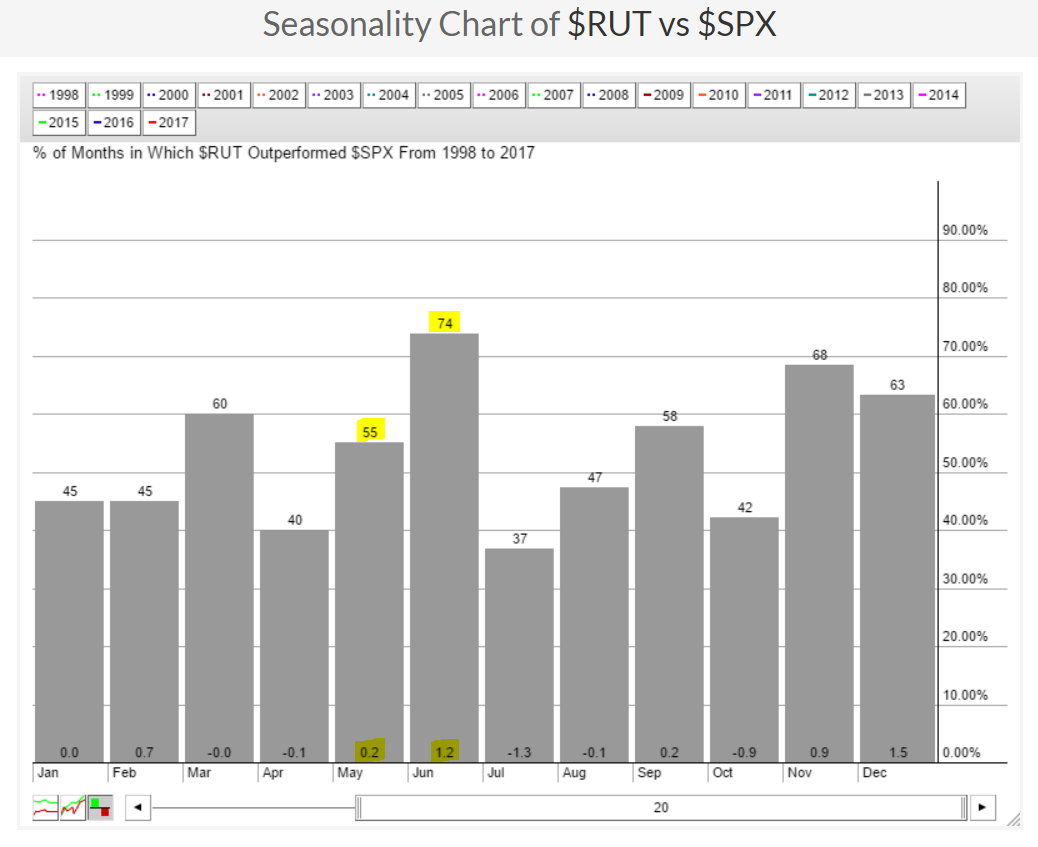
It was another solid day for U.S. equities with index leadership coming from the small caps as the Russell 2000 posted a nice 0.81% rise while the other major indices were just below the +0.50% level. Monday marked only the fourth time this month that the Russell 2000 has outperformed the S&P 500, which is a bit unusual. May, and especially June, tends to see outperformance by small cap stocks as you can see from the seasonality chart below:
 The highlighted numbers in the shaded areas represent the average "outperformance" over the past twenty years. For example, the "1.2" in June tells us that the Russell 2000 averages outperforming the S&P 500 by 1.2% every June. This small cap outperformance in June bests every other calendar month except December.
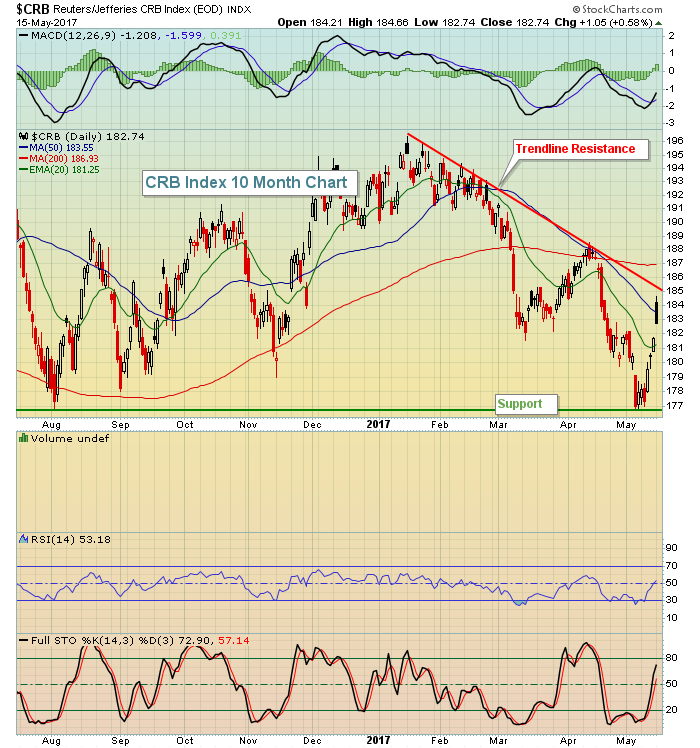
Materials (XLB, +0.87%), energy (XLE, +0.78%) and financials (XLF, +0.76%) were the three leading sectors. The U.S. Dollar index ($USD) closed below 99 once again and dollar weakness no doubt helped to build strength in materials and energy. In fact, the CRB Index ($CRB) tried to close above its 50 day SMA. It would have been the first such close in 2 1/2 months. The CRB Index is featured below in the Sector/Industry Watch section below.
Pre-Market Action
Housing starts and building permits both came in below expectations and that's likely to slow the home construction index ($DJUSHB) one day after it was among the best performing industry groups. The weakness, however, has had little impact on treasury prices and yields as the 10 year treasury yield ($TNX) is up slightly to 2.35%.
As we approach the opening bell here in the U.S., we're again seeing mixed global markets. The good news is that many global markets have broken out to all-time or recent highs and most have confirmed bullish patterns. The overall bullish bias continues this morning as Dow Jones futures are up 36 points.
Current Outlook
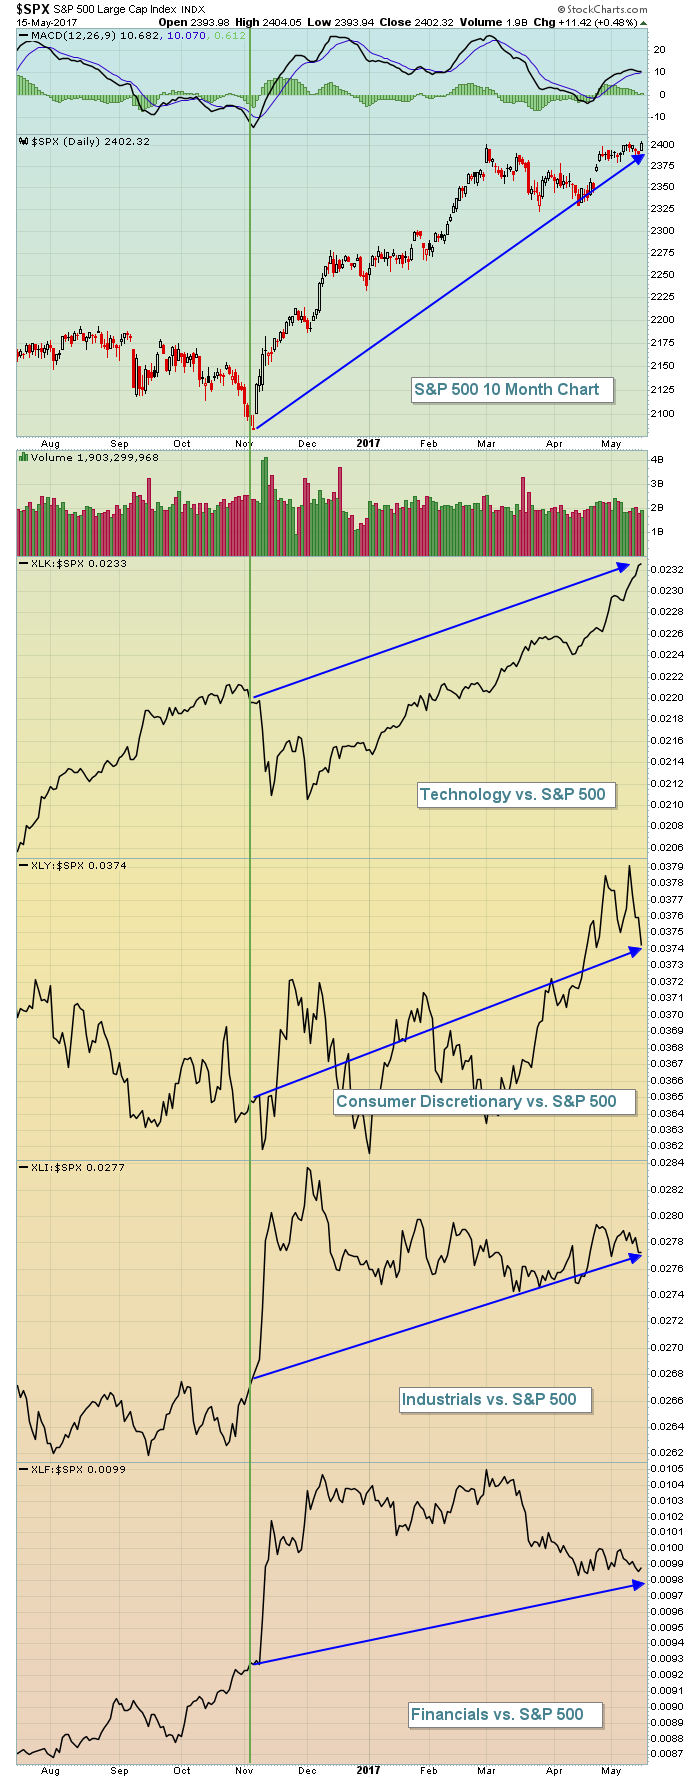
When the S&P 500 is rising and breaking to fresh new highs, I like to look at sector relative strength to see if the aggressive sectors - technology, consumer discretionary, industrials and financials - are leading on a relative basis. Below is the current state of these sectors:
 On this chart, the first thing I note is that momentum is accelerating on the S&P 500. The MACD, after a recent centerline test and reset, is now moving straight up and that lets us know that the short-term 12 day EMA is pulling away from the longer-term 26 day EMA. That's bullish.
More importantly, however, is that all four aggressive sectors have led the action since this S&P 500 rally began in November. They didn't all lead at the same time as rotation is a very critical part of any bull market. Consumer discretionary lagged for quite some time but has just resumed leadership.
Based on this chart, I feel good about the current bull market rally.
Sector/Industry Watch
Commodities have really struggled during much of this bull market as it's been accompanied by a strong U.S. dollar. However, the dollar has been weaker of late and commodities are taking advantage. Below is a chart of the CRB Index showing the attempt to clear its 50 day SMA:
 A close above the 50 day SMA would be the first step in repairing the technical damage inflicted on this chart. Next up would be the downtrend line, which currently intersects near the 185 level. Also, during downtrends the RSI 60 level tends to provide significant headwinds for short-term rallies. We're at 53 and rising now.
Historical Tendencies
It's going to be an interesting next week for the S&P 500 as we just saw an all-time high close on Monday. Historically, however, the S&P 500 has produced annualized losses for eight of the next nine days - beginning tomorrow. The S&P 500's annualized return for today is +11.64%.
Key Earnings Reports
(actual vs. estimate):
HD: 1.67 vs 1.61
TJX: .79 (estimate)
SPLS: .17 vs .17
Key Economic Reports
April housing starts released at 8:30am EST: 1,172,000 (actual) vs. 1,256,000 (estimate)
April building permits released at 8:30am EST: 1,229,000 (actual) vs. 1,271,000 (estimate)
April industrial production to be released at 9:15am EST: +0.4% (estimate)
April capacity utilization to be released at 9:15am EST: 76.3% (estimate)
Happy trading!
Tom
