Market Recap for Wednesday, May 17, 2017
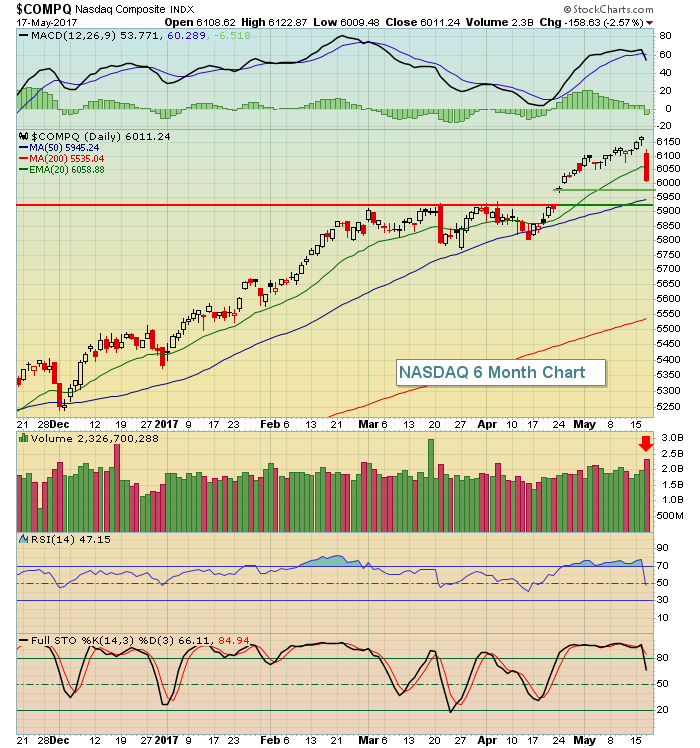
It was a brutal day of selling for U.S. equities. The selling began at the open and continued right through the close. The selling also cleared price support levels and that likely will result in further selling in the days and possibly weeks ahead. The NASDAQ has been the undisputed leader among the major U.S. indices and that index failed to hold rising 20 day EMA support despite a fairly strong MACD. Take a look at the chart and possible short-term scenarios:
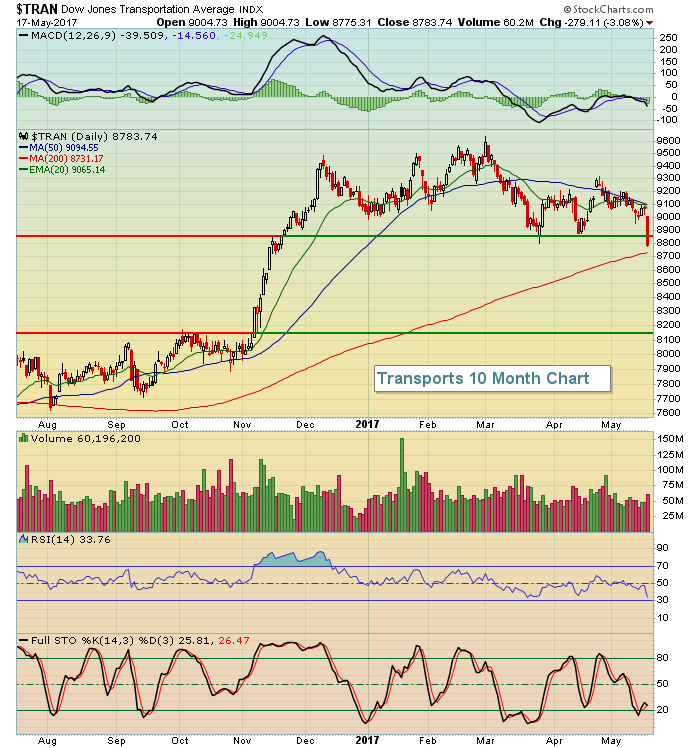
 The weakness on Wednesday was widespread and I could literally pull up chart after chart to show breakdowns. Instead, I want to focus on one very big breakdown in transports ($TRAN). I wrote yesterday about the troubles facing this group in the days and weeks ahead and yesterday's action confirms this in my opinion. Take a look at this breakdown:
 It looks to me like we'll see another 6-7% of downside action here and that should bode well for utilities (XLU) on a relative basis.
While industrials (XLI, -2.11%), the rapidly falling 10 year treasury yield ($TNX) had the biggest impact on financials (XLF, -3.15%) where banks ($DJUSBK) tumbled 4% on the session.
Pre-Market Action
There was selling overnight in Asian markets with the Tokyo Nikkei ($NIKK) taking the brunt of the damage, falling 1.32%. Europe also shows weakness this morning after losses that were more contained than the U.S. on Wednesday.
The 10 year treasury yield ($TNX) tumbled on Wednesday and, despite a couple of solid economic reports this morning, looks to continue its move lower. That's a signal that traders are more nervous than they are focused on data and that could spell trouble for U.S. equities in the near-term.
With 30 minutes left to the opening bell, Dow Jones futures are down 75 points to tack on to their 373 point decline yesterday.
Current Outlook
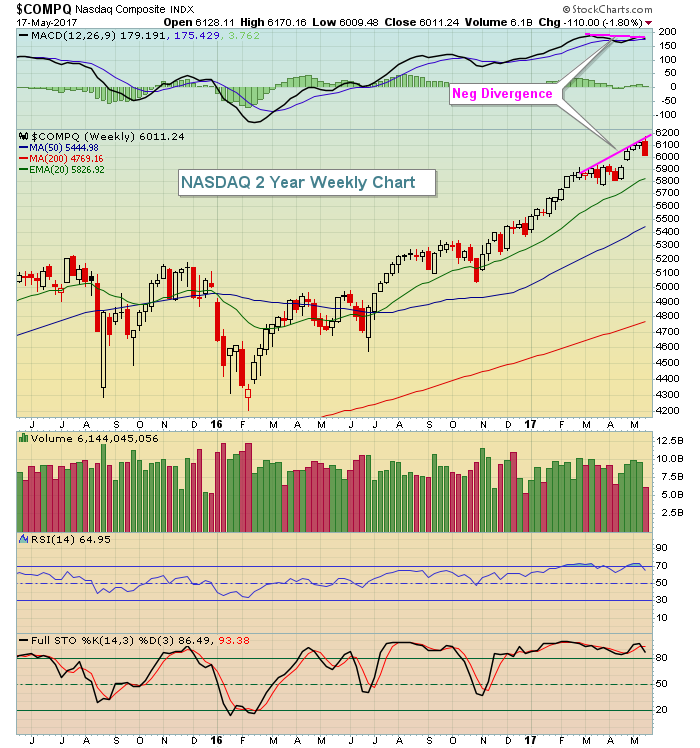
I'll continue with the NASDAQ theme from the Market Recap section above and look at the longer-term selling potential on the weekly chart. We're in the process of printing a reversing weekly candle (bearish engulfing) with a negative divergence in play. There's a chance that the NASDAQ will find price and gap support just above 5900, along with rising 20 week EMA support currently at 5827, but if that fails, 50 week SMA and MACD centerline tests enter the mix. Here's the visual:
 Because this is a weekly chart, the candle won't complete until Friday's close. Unless we see a quick reversal to the upside today or tomorrow, that bearish engulfing candle will hold and "potentially" we could see a selloff down to the 50 week SMA. That would represent a 10% correction for an index that, quite honestly, could use an unwinding of its very overbought oscillators.
Sector/Industry Watch
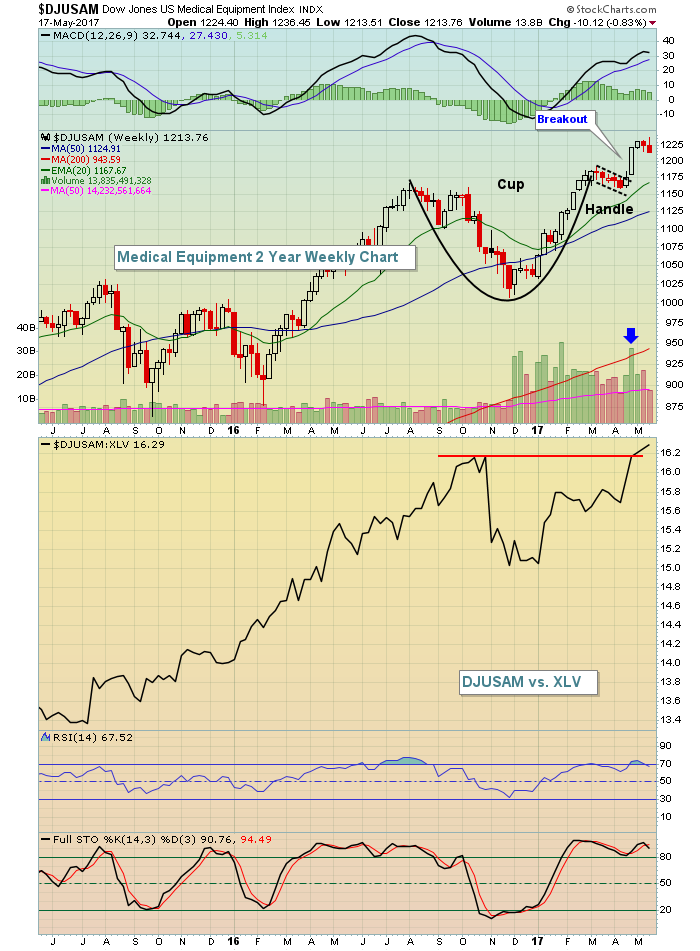
The risk bar has most definitely been raised for trades on the long side. It's likely that defensive areas will represent much better reward to risk trades - areas like healthcare (XLV), utilities (XLU) and consumer staples (XLP). One industry group within healthcare that still remains very bullish is the Dow Jones U.S. Medical Equipment Index ($DJUSAM). After a cup with handle breakout, the recent selling has been contained and the DJUSAM is a leader relative to the XLV. Check it out:
 I like the recent relative breakout but the DJUSAM has been overbought and could use a bit more selling down to perhaps 1190 to touch price support and relieve its oscillators.
Historical Tendencies
The Russell 2000 really struggles historically once we get past the month of May. Given the negative divergence currently present on the RUT's weekly chart, I wouldn't be surprised to see the next few months produce negative results. From June through October, only June has produced positive annualized returns since 1987 and that is a fractional gain. Look for underperformance from small caps as we move throughout the summer months.
Key Earnings Reports
(actual vs. estimate):
BABA: .39 vs .47
WMT: 1.00 vs .96
(reports after close, estimate provided):
ADSK: (.36)
AMAT: .76
CRM: .05
GAP: 29
MCK: 3.04
ROST: .79
Key Economic Reports
Initial jobless claims released at 8:30am EST: 232,000 (actual) vs. 240,000 (estimate)
May Philadelphia Fed Survey released at 8:30am EST: 38.8 (actual) vs. 19.6 (estimate)
April leading indicators to be released at 10:00am EST: +0.3% (estimate)
Happy trading!
Tom
