Market Recap for Tuesday, March 21, 2017
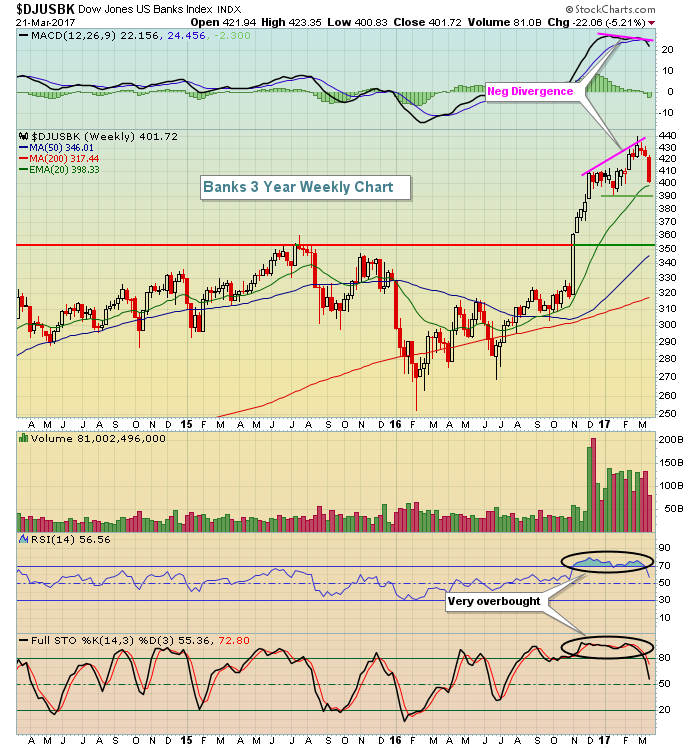
After months of steady gains, Tuesday's action was painful with eight of nine sectors lower - the utilities sector (XLU, +1.39%) was the lone exception. Further, our major indices were led to the downside by the more aggressive Russell 2000, which dropped 2.71%. The biggest losses were felt in banks ($DJUSBK) where the group tumbled more than 4%. Stocks like Deutshe Bank (DB, -7.07%) and Bank of America (BAC, -5.81%) led a brutal day for the industry. There are a couple things to consider technically with the banks now. First, let's take a look at the weekly chart:
 The negative divergence is bothersome because we could see a 50 week SMA test as a result. The key support level on the banks right now is from 390-400. That needs to hold or we could see a significant selling episode. Longer-term, I still see the 10 year treasury yield ($TNX) rising and banks recovering, but we'll need to withstand this profit taking first.
Volatility ($VIX) surged nearly 10% on Tuesday, but remains at 12.47, well below the 14.16 high close since this bull market rally began. A rise in the VIX above 14.16 would likely trigger further selling in U.S. equities.
Pre-Market Action
The profit taking has extended globally. Crude oil ($WTIC) is below $48 per barrel, its lowest level since late November. The dollar ($USD) is in a very important support range from 99-100 and its recent weakness has benefited gold ($GOLD), which is challenging $1250.
Asian stocks were hit hard overnight, with the Tokyo Nikkei ($NIKK) leading the charge with losses of more than 400 points, or -2.13%. Europe this morning is extending its losses from Tuesday as well.
Dow Jones futures are down by 41 points with 30 minutes left to the opening bell.
Current Outlook
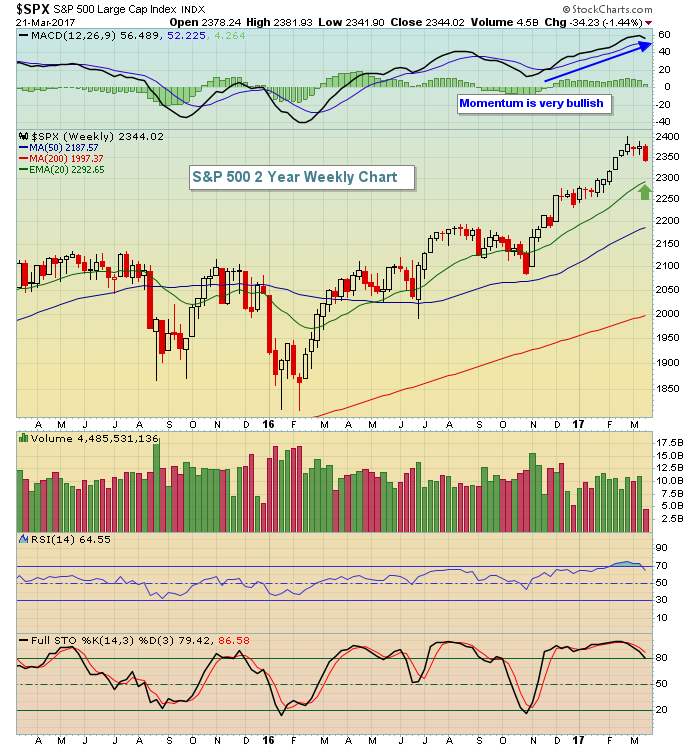
Any time we see a day like we saw yesterday, everyone's attitude changes a bit. The current rally hadn't seen a big day of profit taking since early November. Not one. There hadn't been a single day where the S&P 500 lost 1% during the rally. That changed yesterday. It doesn't feel good when it happens but the market does need to correct from time to time. In my recent webinars, I've discussed the possibility of 20 week EMA tests and that's what we could be looking at here. Check out the following chart to see where that might take us on the S&P 500:
 The selling has helped to relieve overbought momentum oscillators as the weekly RSI was well into the 70s. A trip back to RSI 50ish wouldn't be a bad thing at all.
Sector/Industry Watch
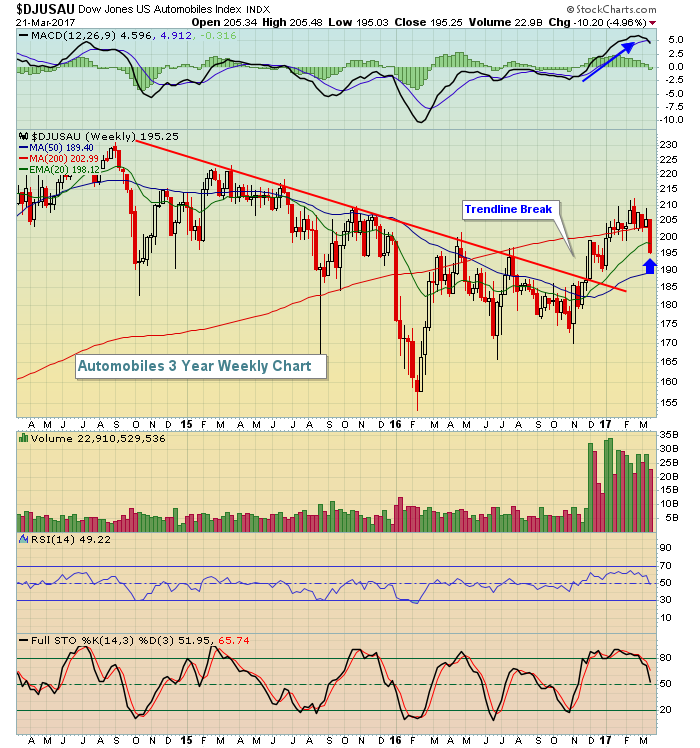
The Dow Jones U.S. Automobiles Index ($DJUSAU) will be worth watching. Its daily chart broke down badly yesterday as the DJUSAU fell 3.87%. However, this could be a test of its rising 20 week EMA on the longer-term chart. We still have three days before this week's candle is complete. A recovery by week's end could print a reversing candle on that key moving average. Take a look at the chart:
 It appears that automobiles broke a downtrend line and began a fresh uptrend in December. If that's true, then I'd look for rising 20 week EMA support to hold. Therefore, by Friday's close, we need to see the DJUSAU back above the 198-200 area.
Historical Tendencies
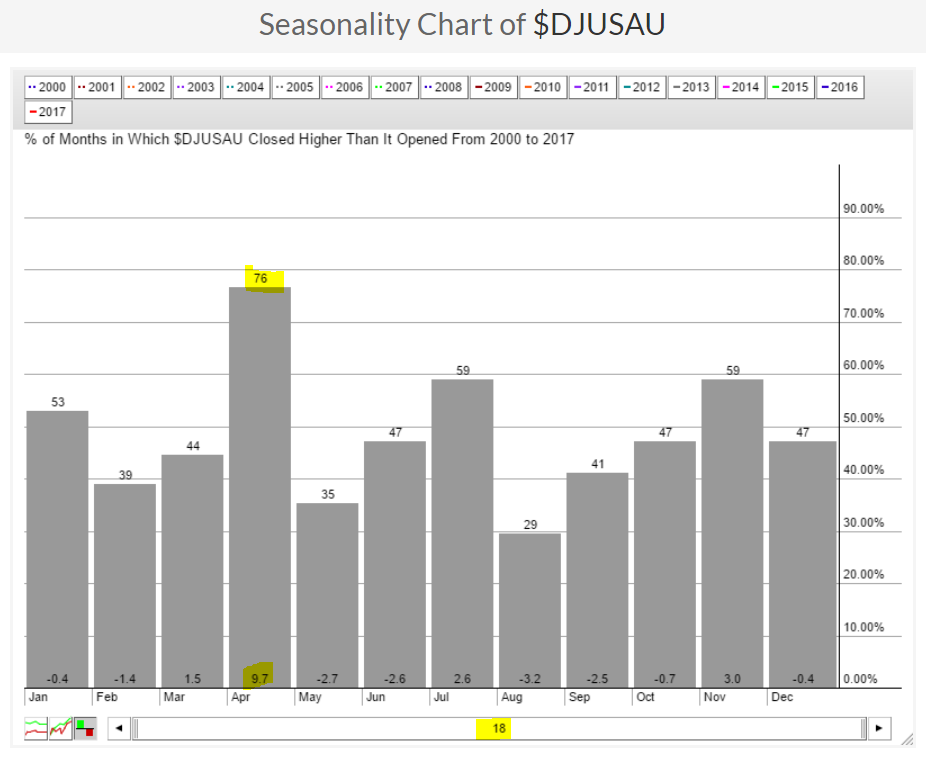
I mentioned automobiles above and how a kick save at the rising 20 week EMA would be bullish. That also would fit with the DJUSAU historical performance. April is by far its best month historically as you can see from the chart below:
 Automobiles have averaged rising 9.7% during the month of April over the last 18 years.
Key Earnings Reports
(reports after close, estimate provided):
CTAS: 1.06
PVH: 1.22
Key Economic Reports
January FHFA house price index to be released at 9:00am EST: +0.5% (estimate)
February existing home sales to be released at 10:00am EST: 5,555,000 (estimate)
Happy trading!
Tom
