Market Recap for Wednesday, March 22, 2017
A strong technology sector (XLK, +0.63%) helped to lift the NASDAQ to moderate gains while the other major U.S. indices waffled near the flat line on Wednesday, a day after equities experienced their sharpest selling of 2017. From a bullish perspective, it was calming to see stocks maintain their resiliency. It would have been easy to see much more selling yesterday as follow through from Tuesday, but outside of a little early morning weakness, it never materialized.
The 10 year treasury yield ($TNX) continues to decline after both the bond and equity markets perceived that the Fed turned slightly dovish at its meeting last week. While the quarter point rate hike was baked into prices, many pundits were expecting the Fed to possibly increase the number of hikes for 2017, but they didn't. Since last week's announcement, the TNX has fallen considerably as you can see below:
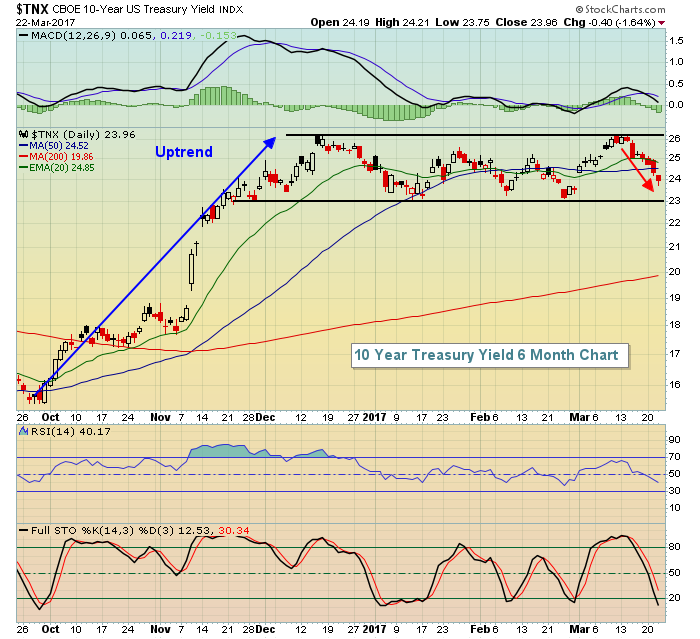 The rise in the TNX lifted key financial stocks so it only makes sense that the struggles in the TNX over the past week would hurt the group. The financial sector (XLF) is now down 4.59% over the last week since the FOMC announcement with banks ($DJUSBK) leading the downturn. Ultimately, I look for the TNX to rally again and break above 2.62% yield resistance. If it does, look for a solid rebound in the bank stocks as well.
Transports ($TRAN) fell on Tuesday, and did not hold onto key short-term support as you can see below:
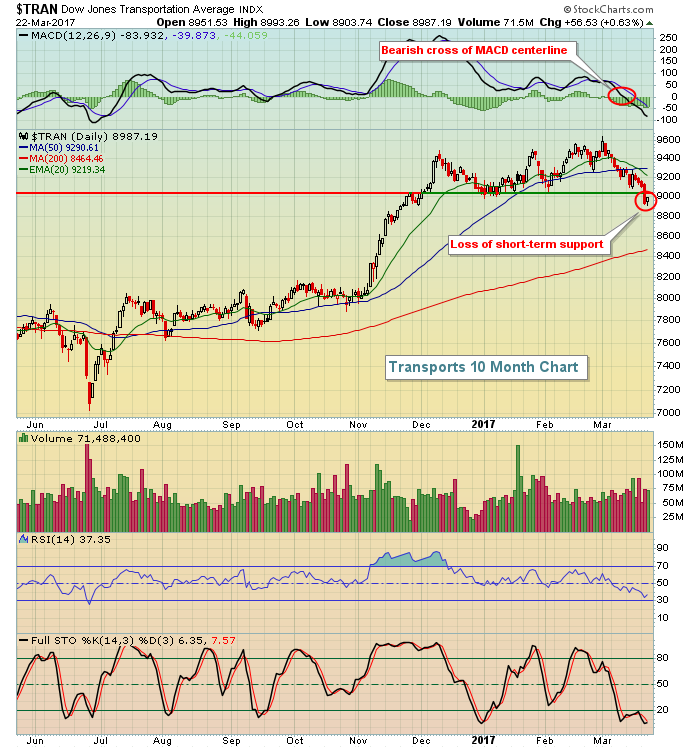 But while the daily chart is reflecting a price support breakdown, the weekly chart has not seen a close beneath its rising 20 week EMA. Therefore, I think it's premature to conclude we've seen a key breakdown in the transports. And while not pictured here, the Dow Jones U.S. Railroads Index ($DJUSRR) is just now testing the top of key gap support. So an argument could be made we're possibly at a reversal level. Today will be interesting.
Pre-Market Action
Initial jobless claims came in worse than expected and February new home sales are on tap for later this morning with 565,000 the estimate. The home construction group ($DJUSHB) has been leading the benchmark S&P 500 higher in 2017 so it'll be important to see how this group reacts to its recent 20 day EMA test. The chart can be seen below in the Current Outlook section.
Overnight, key Asian markets posted minor gains while the German DAX ($DAX) is up 0.42% at last check to lead European markets mostly higher. The Dow Jones futures are higher by 14 points with about 30 minutes left to the opening bell.
Current Outlook
I like to see leaders perform well during pullbacks, holding onto key support levels. The DJUSHB is certainly one of those leaders and a key new home sales report will be released at 10am EST this morning - one day after the industry group successfully tested its rising 20 day EMA. The following chart shows this bounce off 20 day EMA support and also reflects its serious relative strength (vs. the S&P 500) enjoyed since the beginning of 2017:
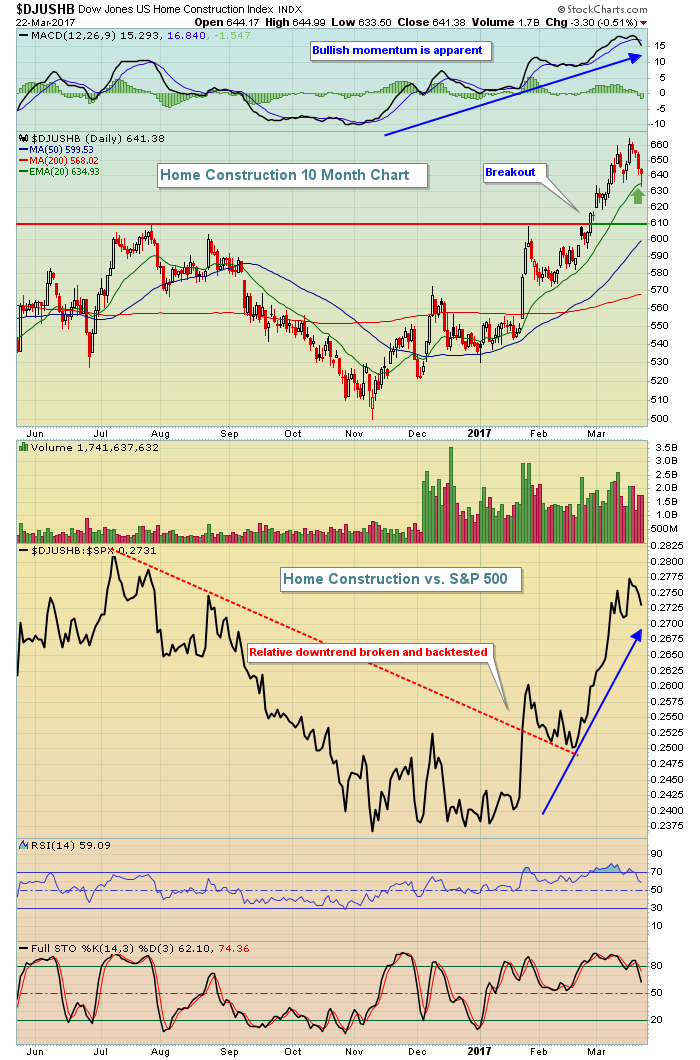 I'd look for the DJUSHB to break to fresh highs, but there is one warning sign that could begin to flash. The daily MACD has fallen back so another price high could result in a negative divergence. That next high should be evaluated to see if the rally appears to be losing steam. Low volume days on component stocks like DR Horton (DHI), Lennar Corp (LEN), Home Depot (HD) on such a breakout could provide clues to confirm the negative divergence.
Sector/Industry Watch
The Dow Jones U.S. Hotels Index ($DJUSLG) finished printing the top of a cup on Tuesday and by the time the close arrived, it had also printed the handle. Yesterday's action saw the DJUSLG lead most industry groups, including all financial sector industry groups, and it managed to close above key price resistance to break out to an-all time high. Check it out:
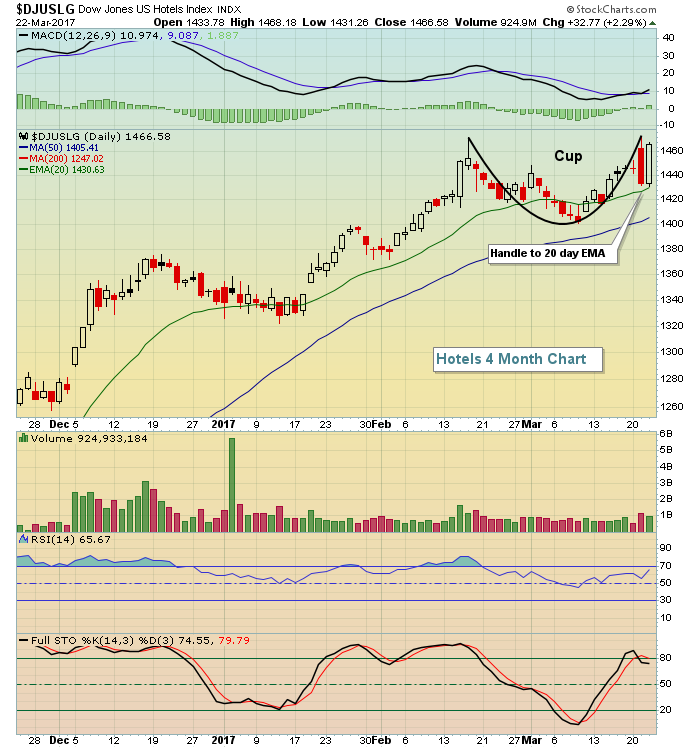 The performance of the DJUSLG fits with its tendencies historically. Take a look below at the Historical Tendencies section for more details.
Historical Tendencies
Hotels ($DJUSLG) typically perform very well during the month of March and that strength tends to carry over into April as you can see from the Seasonality chart below:
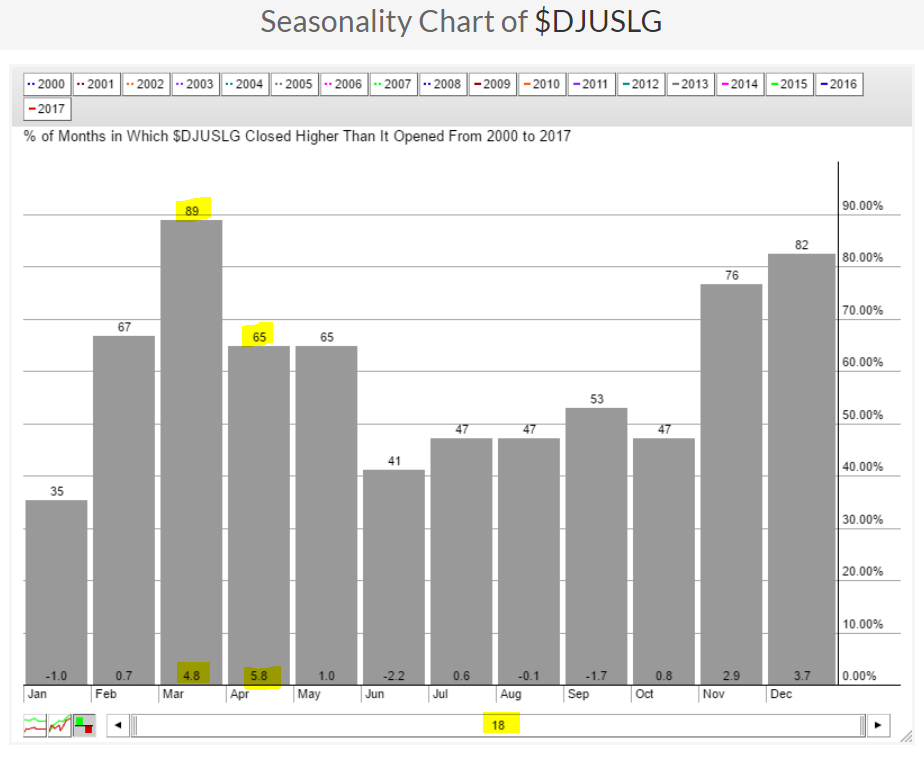 The probably of a bullish March is at 89% over the past 18 years and the month has produced average returns of 4.8% over that period. The only calendar month that produces better average returns is April at 5.8%. This is the sweet spot for hotels and the group looks great technically.
Key Earnings Reports
(actual vs. estimate):
ACN: 1.33 vs 1.30
CAG: .48 vs .45
(reports after close, estimate provided):
MU: .77
Key Economic Reports
Initial jobless claims released at 8:30am EST: 258,000 (actual) vs. 240,000 (estimate)
February new home sales to be released at 10:00am EST: 565,000 (estimate)
Happy trading!
Tom
