Market Recap for Wednesday, March 1, 2017
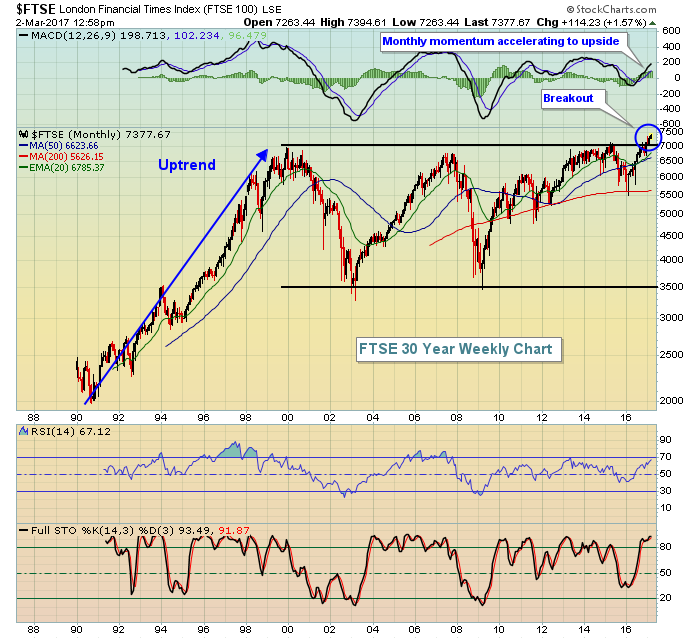
U.S. equities surged on Wednesday, with the Dow Jones and S&P 500 gaining 1.46% and 1.37%, respectively. The small cap Russell 2000 rebounded big time after its Tuesday drubbing, spiking 27 points, or 1.94%, to 1413 - an all-time high close. It wasn't just a U.S. rally, however, as global markets exploded higher, particularly in Europe where both the London Financial Times ($FTSE) continued its recent breakout after a multi-decade consolidation period. If the following chart doesn't excite you, I'm not sure what will:
 The breakout cleared a 17 year resistance level that very well could lead to many, many years of strength.
Here in the U.S., we saw strength in areas where we want to see strength. Financials (XLF, +2.85%) surged as the 10 year treasury yield ($TNX) bounced strongly after nearing key yield support close to 2.30%. The TNX was up 10 basis points to 2.46%. The latest beige report was released at 2pm yesterday and while optimism appeared to wane a bit, there's still a very real possibility of a rate hike when the FOMC meets in a couple weeks. That possibility had traders scrambling to buy financial companies, many of which see profits explode during periods of rising interest rates. Energy (XLE, +2.00%) and industrials (XLI, +1.69%) also were among the leading sectors and these two, along with the XLF, tend to outperform the benchmark S&P 500 during the months of March and April. Wednesday was not a bad start to this seasonally strong period.
Utilities (XLU, -0.89%) represented the only sector that lost ground on Wednesday, but that makes sense with such a significant rise in the TNX. On a daily basis, the XLU had become very overbought and it was also nearing its July 2016 high. So it was due for some profit taking and the higher TNX provided just that.
Pre-Market Action
Initial jobless claims came in well below expectations (see Key Economic Reports section below) and we're seeing a mixed picture of earnings results. After such a huge advance on Wednesday, traders are pausing this morning, although Dow Jones futures are up 34 points with roughly 30 minutes left before the open.
The 10 year treasury yield ($TNX) is up another basis point to 2.47% in response to the better than expected jobless claims, while crude oil ($WTIC) has tumbled nearly 1.5% this morning. Gold ($GOLD) is down approximately 1% and we could see the GLD test its rising 20 day EMA, which will be a critical test in my view. The long-term downtrend remains in place on gold and the rising 20 day EMA is a key support level given the recent strength in this metal.
Current Outlook
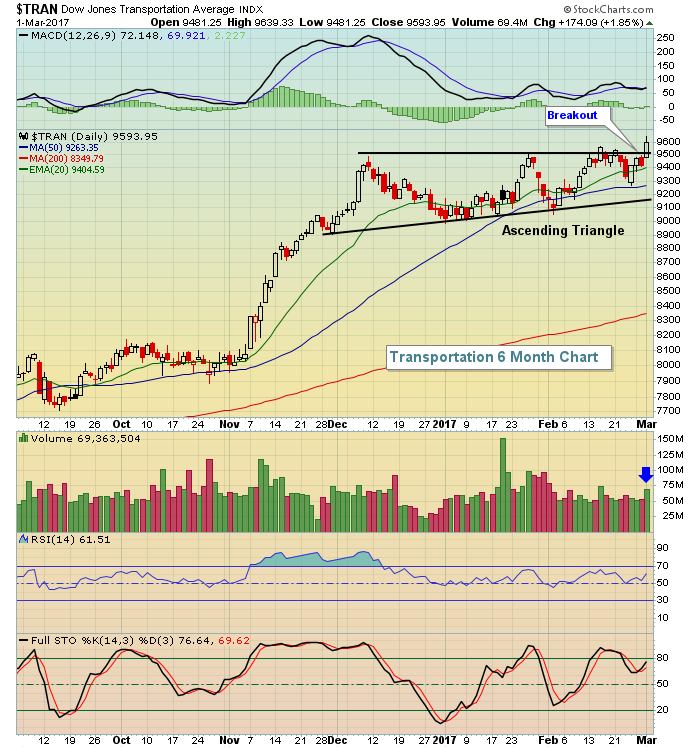
The Dow Jones U.S. Transportation Average ($TRAN) has broken out on its daily chart and has done so after consolidating for the past two months. That's a solid signal for anticipated economic strength ahead. While the fundamentals are important to watch, technical price action provides us early signals and the following picture says a thousand words:
 Transportation stocks perform well during periods of strengthening economic conditions so the fact that we're seeing another breakout after a bullish ascending triangle had formed suggests to me that we'll likely see further gains here in the foreseeable future. The confirming heavy volume on a breakout day adds to the bullishness.
Sector/Industry Watch
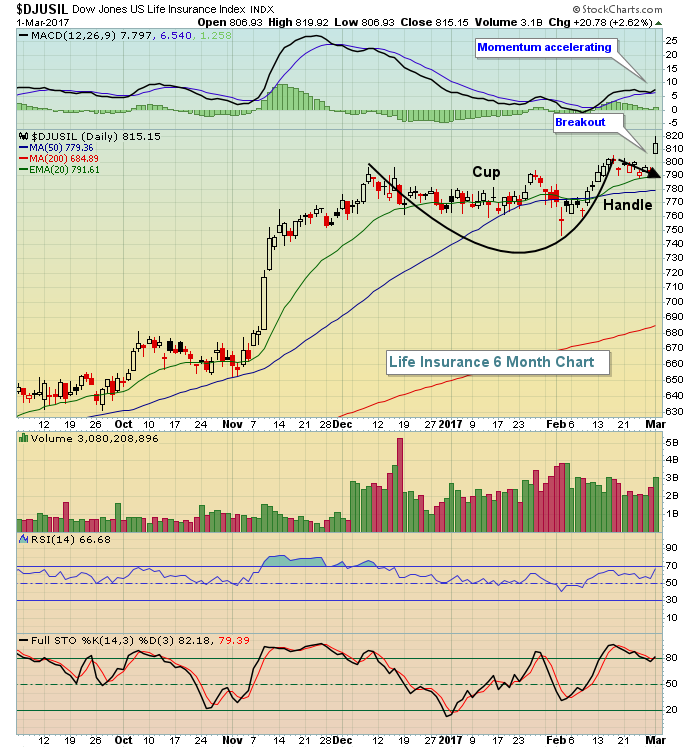
Life insurance ($DJUSIL) benefits from higher treasury yields so it shouldn't come as too much of a surprise that this industry group loved the 10 basis point hike in the TNX on Wednesday. Furthermore, the DJUSIL broke out of a cup with handle pattern that should lead to further gains. Check out the visual:
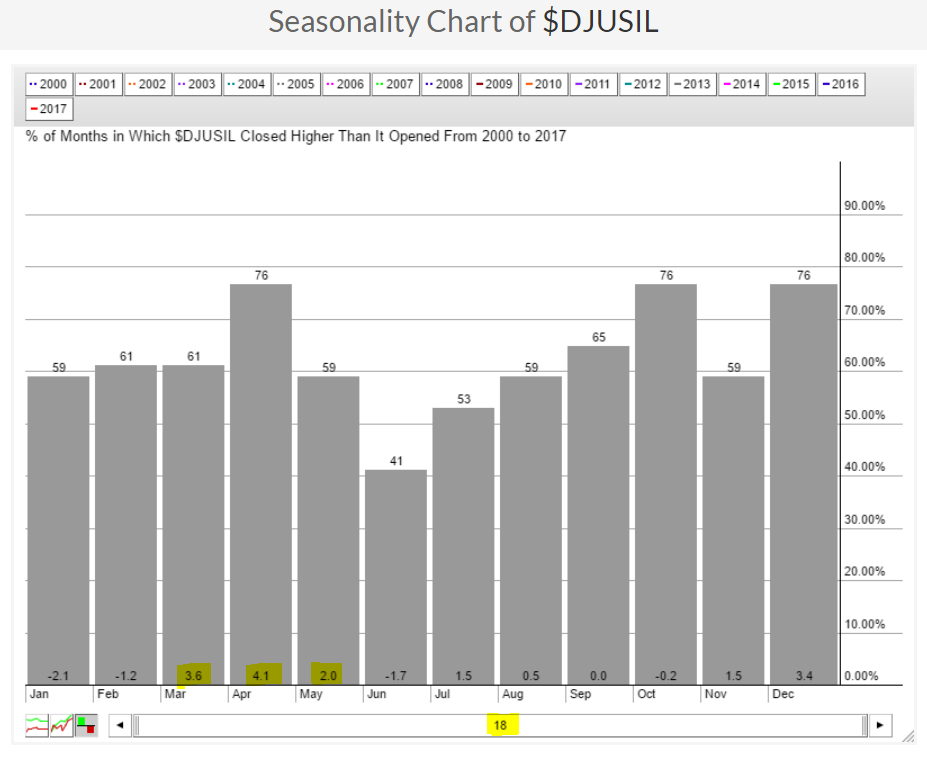
 This isn't the perfect symmetrical cup, but the consolidation after the uptrend is clear and the increasing volume to support the new high is very bullish. Furthermore, from a seasonal perspective, insurance companies love this time of year. Check out the seasonal tendencies for the DJUSIL:
 I've highlighted the strong average returns during the months of March, April and May. Given that we just broke out technically and the clear bullish seasonal pattern, I believe life insurance is an area to consider over the next several weeks.
Historical Tendencies
I mentioned in yesterday's Trading Places blog article that the 1st calendar day of the month has been the best day on the S&P 500 dating back to 1950. That bullishness typically continues to carry over to the second and third calendar days of the month. Here's a recap of the 1st to 3rd of ALL calendar months (not just March):
1st: +46.17%
2nd: +38.38%
3rd: +25.07%
Considering that the S&P 500 has an average annual return of roughly 9%, the outperformance early in calendar months is quite noteworthy and should be considered in your trading strategy.
Key Earnings Reports
(actual vs. estimate):
ABEV: .08 vs .08
BUD: .43 vs 1.03
BURL: 1.78 vs 1.70
CNQ: .38 vs .07
JD: vs (.18) - have not seen actual EPS yet
KR: .53 vs .53
TD: 1.00 vs .96
(reports after close, estimate provided):
ADSK: (.49)
COST: 1.35
MRVL: .13
Key Economics Reports
Initial jobless claims released at 8:30am EST: 223,000 (actual) vs. 245,000 (estimate)
Happy trading!
Tom
