Market Recap for Wednesday, November 9, 2016
Talk about your fickle traders. A little more than 24 hours ago with traders around the globe wrestling with an unexpected Presidential victory by Donald Trump, equities sold off hard. The Dow Jones futures were down 800 points at its low. Japan's NIKKEI ($NIKK) finished down more than 5% before global markets began to rally. Fast forward to Wednesday's close. The Dow Jones and S&P 500 finished higher by 1.40% and 1.11%, respectively, completely reversing those earlier ugly futures. Many market pundits had predicted financial ruin if Trump were to be elected, but it wasn't the case at all. In fact, you could argue the opposite is true as the benchmark S&P 500 is likely to open within 1% of its all-time high based on strong futures this morning.
But why?
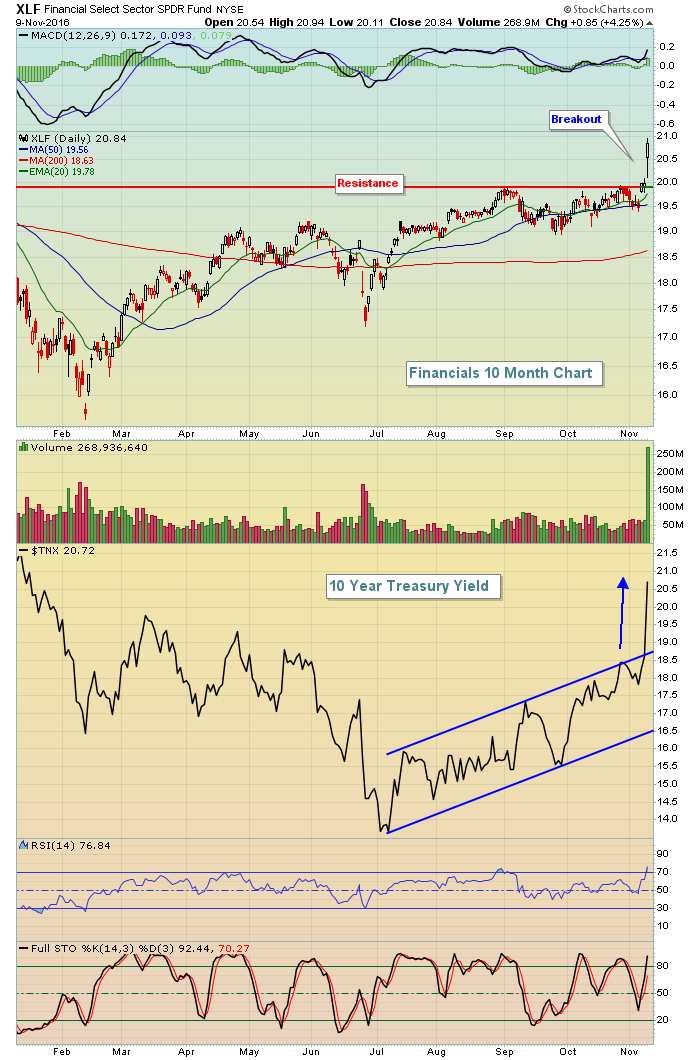
As a technician, I don't try to answer that question. It's simply not important to a technician. We follow the price action and base our trading decisions and expectations on those signals. The rest we leave the media to ponder. The key to the rally yesterday in my view was the solid bullish rotation. Financials (XLF, +4.25%), healthcare (XLV, +3.52%) and industrials (XLI, +2.51%) led the recovery and buying frenzy. No doubt healthcare buyers were relieved that there'd be no Clinton presidency. The likelihood that Obamacare would be repealed or changed in some manner gave traders reason to hop on board the group. Biotechs ($DJUSBT, +7.78%) were the primary beneficiaries as that group has now bounced off 1500 support, gaining more than 13% over the past four trading days. But the real winner has been the financials and they soared again yesterday with a surging 10 year treasury yield ($TNX). Here's the recent action:
 If there was one clear message post-election, it's that traders wanted no part of treasuries. There was massive selling of treasuries with the corresponding yields soaring. The TNX jumped 21 basis points and closed at its highest level (2.07%) since early 2016. The best news for bulls is that the proceeds from those treasury sales found their way into the equity market, with much of the money skewed toward aggressive areas. Should that continue with a breakout on our major indices and this bull market would most definitely be alive and kicking.
Pre-Market Action
On the heels of a remarkable rally in U.S. equities from the depths of Wednesday's early morning futures to the closing bell, we see futures are higher this morning to continue the rally. Japan's NIKKEI ($NIKK) erased 5% losses from two nights ago to gain nearly 7% last night. Global markets are higher just about everywhere with the German DAX ($DAX) now within 1% of its all-time high.
Dow Jones futures are up 84 points at last check.
Current Outlook
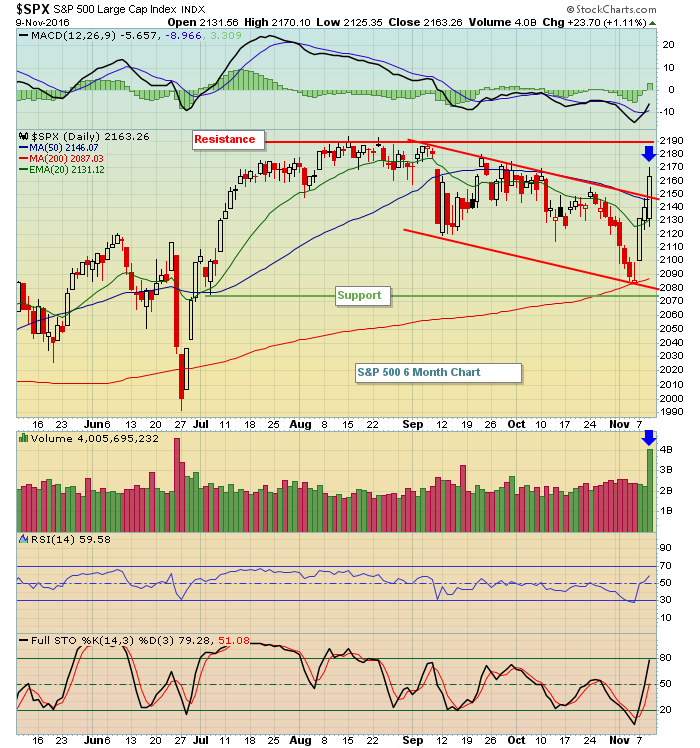
The current environment seems so much like post-Brexit. Initially, everyone thought Brexit would rip apart global markets and it began to do just that. Then prices turned on a dime and the July rally was on. The reaction to the U.S. presidential election has been quite similar thus far, although it's yet to be determined if this rally continues. I would now consider 2075-2190 to be our trading range on the S&P 500 as follows:
 The volume was very strong on Wednesday's rise with S&P 500 volume exceeding 4 billion shares. Price action, while not breaking above August all-time highs, did manage to break the recent three month down channel and given the heavy volume it needs to be respected.
The other bullish development on Wednesday was the 23% collapse in expected volatility ($VIX). The close of 14.38 is noteworthy because during the prior two bear markets, we never saw a close below 16. High VIX readings are a very important sentiment component of bear markets and the huge drop should also be respected if you're in the bearish camp. Perhaps this will be nothing more than a one to two day reprieve before another big downside move as anything is possible in the stock market and technical indications provide us no guarantees, but the signals being sent right now are quite bullish.
Sector/Industry Watch
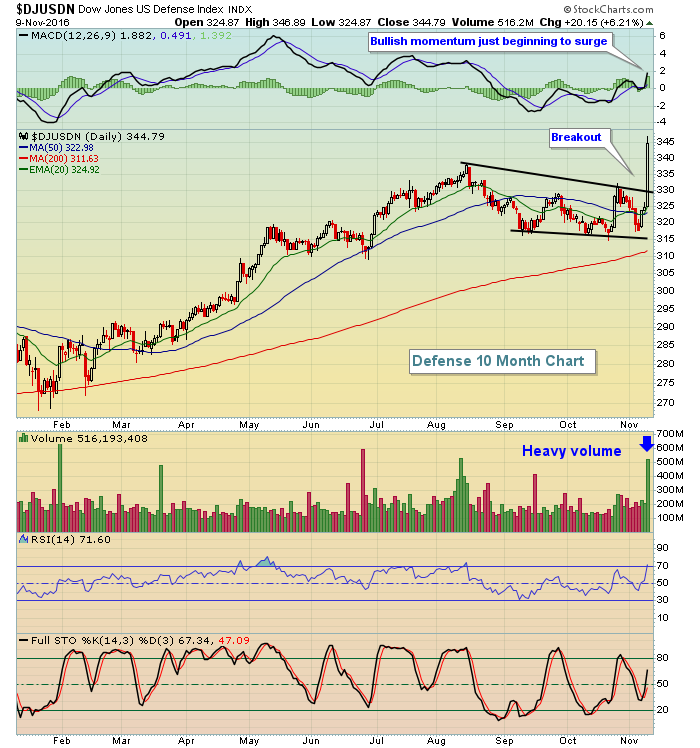
The Dow Jones U.S. Defense index ($DJUSDN) surged through price resistance, breaking out of a bullish wedge on heavy volume in the process. Take a look at the visual:
 Defense stocks have a very strong seasonal history in that they only have one calendar month where they've produced average losses over the past 13 years (June, -1.0%). November and December have produced average gains of 1.2% and 1.7%, respectively, over that same period. A pullback to test the previous August high near 338 would represent solid entry into this space.
Historical Tendencies
November and December are easily the two best consecutive calendar months for small cap stocks since 1987. But the action in November varies by period. For instance, consider the following periods and accompanying annualized returns:
November 1-6: +54.17%
November 7-22: -30.31%
November 23-30: +84.06%
Of course these are just tendencies based on actual historical data, but nonetheless an indicator worth considering.
Key Earnings Reports
(actual vs. estimate):
AZN: 1.32 vs .48
CCE: .74 vs .72
KSS: .80 vs .67
M: .17 vs .40
MFC: .34 (estimate, haven't seen actual)
PRGO: 1.65 vs 1.59
RL: 1.90 vs 1.70
TM: 2.51 vs 2.12
(reports after close, estimate provided):
DIS: 1.15
JWN: .52
KORS: .88
NVDA: .56
PBR: .09
Key Economic Reports
Initial jobless claims released at 8:30am EST: 254,000 (actual) vs. 263,000 (estimate)
Happy trading!
Tom
