RRG Charts May 26, 2020 at 08:00 PM

On this episode of Sector Spotlight, I review the current rotations for asset classes and sectors. In addition, I explain how your investment horizon and timeframe is crucial in determining how you view the markets. This video was originally broadcast on May 26th, 2020... Read More
RRG Charts May 26, 2020 at 12:35 PM

Communication is key... The Communication Services started to come alive again after a dull period, at least in relative terms. Recently, I wrote about the sector here in a Don't Ignore This Chart article ("Is Everybody Calling and Texting or What?")... Read More
RRG Charts May 19, 2020 at 01:44 PM

On this episode of Sector Spotlight, I look at recent rotations in asset classes and sectors. Next, I present updated BETA values for sectors and compare cap-weighted vs equal-weight values. Finally, I then finish up the show with a pair trade review... Read More
RRG Charts May 13, 2020 at 09:40 AM

Growth-Value is a pre-defined group on the RRG page, showing the relative rotation for the Dow Jones Growth Index vs. Dow Jones Value Index, using the Dow Jones US index as the benchmark... Read More
RRG Charts May 12, 2020 at 11:59 AM

On this episode of Sector Spotlight, I highlight the Technology sector and picks some Tops and Flops that are worth keeping an eye on using RRG. In the second part of the show, I answers a question from the Mailbag and suggest a new pair trade idea... Read More
RRG Charts May 12, 2020 at 11:46 AM

This article appeared in the Chartwatchers newsletter last weekend (5/9) but as it touches on one of the core interpretation basics for Relative Rotation Graphs I wanted to have it in the RRG-blog as well... Read More
RRG Charts May 05, 2020 at 06:30 PM

On this episode of Sector Spotlight, I walk through asset classes and US sectors using RRG in combination with monthly charts. Afterwards, I answer a question from the mailbag regarding the alignment of weekly and daily RRGs... Read More
RRG Charts May 05, 2020 at 10:00 AM

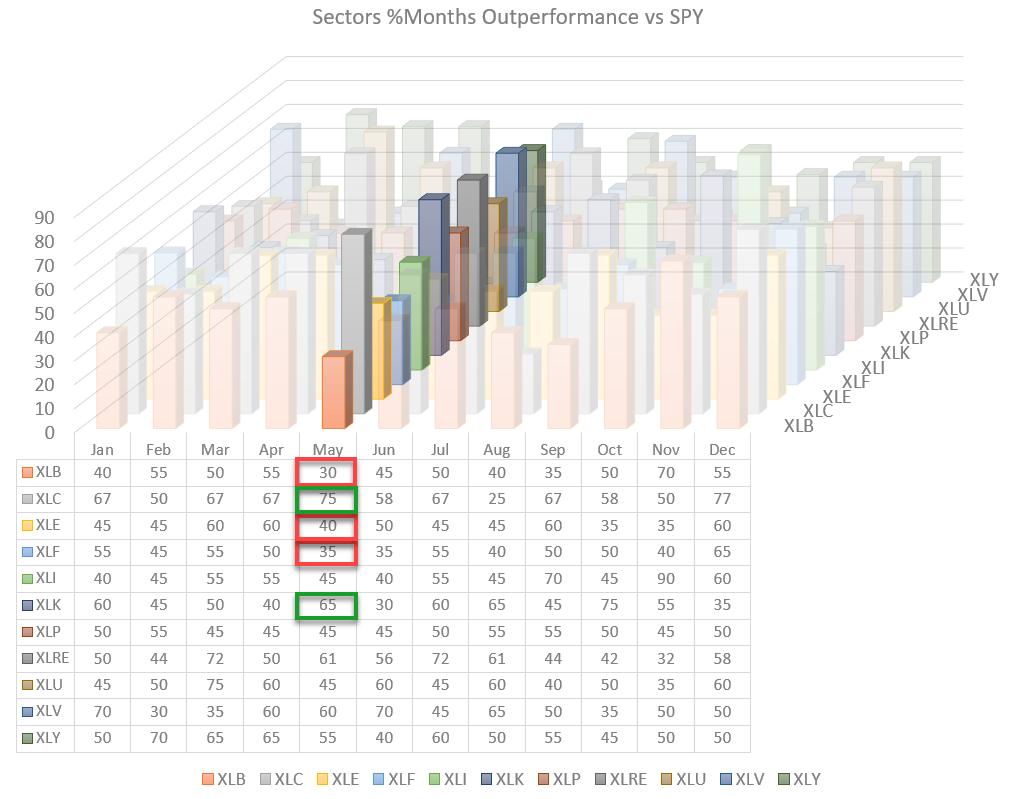
At the end of the month, or the beginning of a new month, I like to look at the expected strength for sectors based on seasonality. The chart above visualizes the seasonal strength for US sectors in one 3D image... Read More