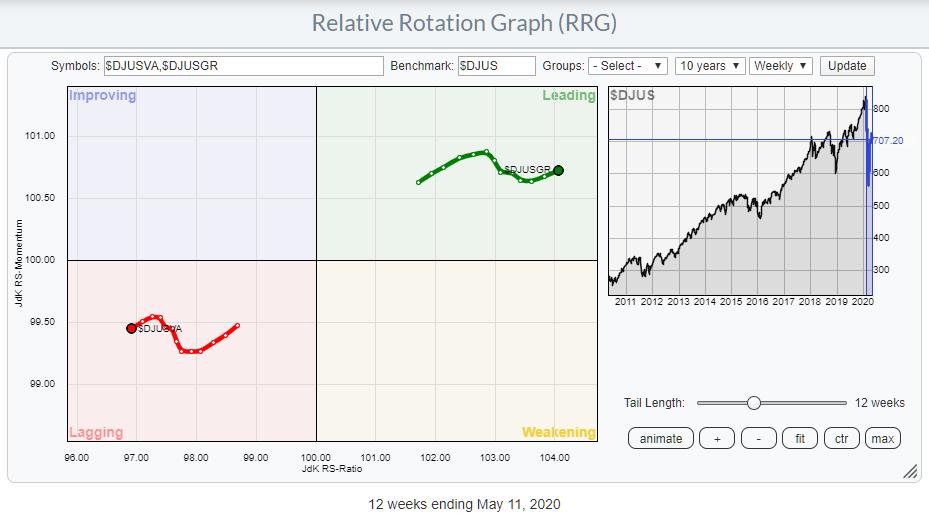
Growth-Value is a pre-defined group on the RRG page, showing the relative rotation for the Dow Jones Growth Index vs. Dow Jones Value Index, using the Dow Jones US index as the benchmark.
The last crossover for Value into the leading quadrant, and Growth into lagging, happened in November 2018. That rotation lasted until March 2019, when Growth came back into leading and Value to lagging. And, despite the sharp drop, growth is still moving (deep) inside the leading quadrant while value is inside lagging.
Weekly and Daily Tails
As a matter of fact, the mayhem in the stock market and the ~30% drop in stocks only caused a temporary setback.

This RRG starts at the week beginning 2/18, in which the market recorded its high, and ends this week (beginning 5/11). The low was set in the week beginning 3/23.
As you can see, the tail for growth only rolled over for a few weeks; it is now picking up its rotation further into the leading quadrant again at a renewed positive RRG-Heading. The Value tail shows the (almost) exact opposite rotation.
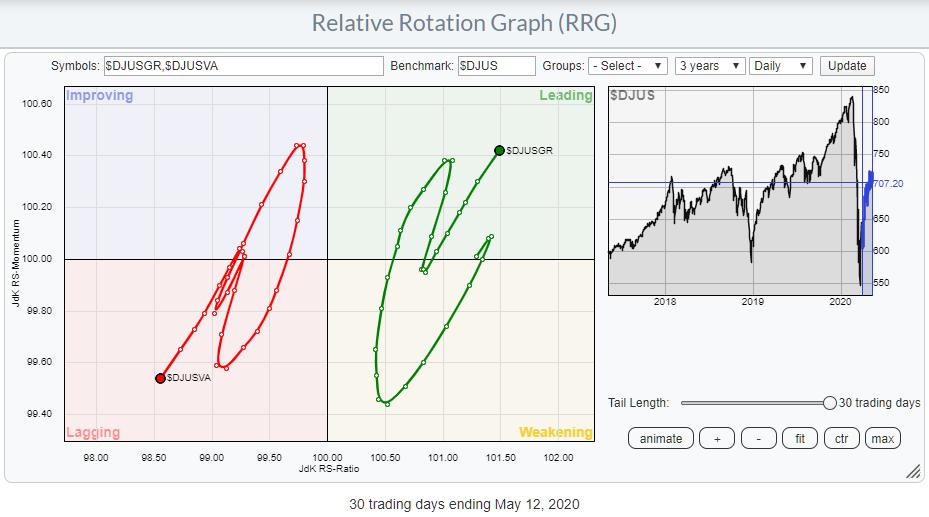
On the daily RRG, the tail started to roll over mid-March, which caused the "ripple" on the weekly tail. After a rotation through weakening and then back into leading, this daily tail started to roll over again at the end of April and hit the weakening quadrant on 4/30 for three days, before hooking up sharply and accelerating back into leading again, where it now still is at a strong RRG-Heading.

This means that daily and weekly rotations are now, again, both in favor of growth stocks.
I'm not sure how this ties in with a weak economy, job losses, terrible earnings and more of these "not so nice" facts, but it is what it is and Mr. Market is always right, so, for the time being, growth remains in favor.
Which Part of Growth?

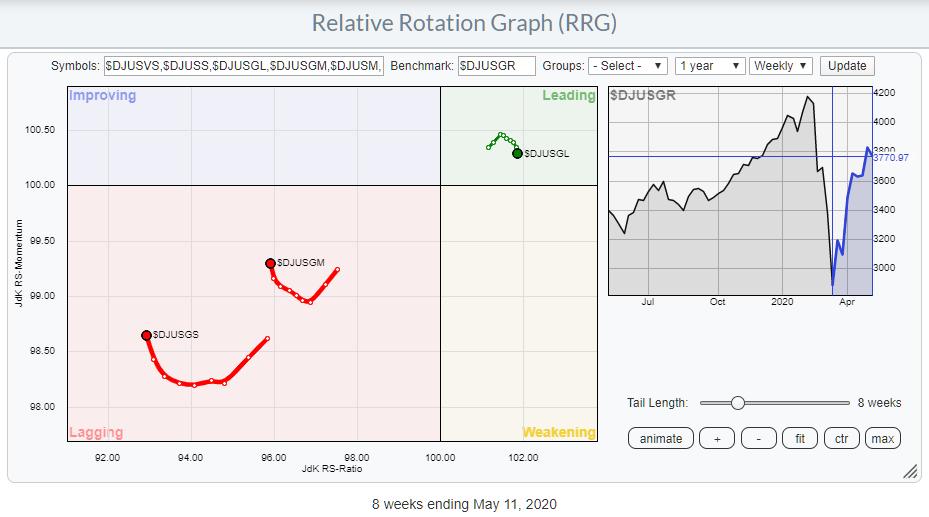
This Weekly RRG shows the three segments of market capitalization; large-, mid- and small-caps versus DJ US Growth. What is interesting to see is the tail for large-cap growth rolling over inside the leading quadrant while the tails for small- and mid-cap curling up inside lagging.
They are still far apart on the JdK RS-Ratio scale, so it's still early, but some movement out of large-cap and into small- and mid-cap seems to be underway.
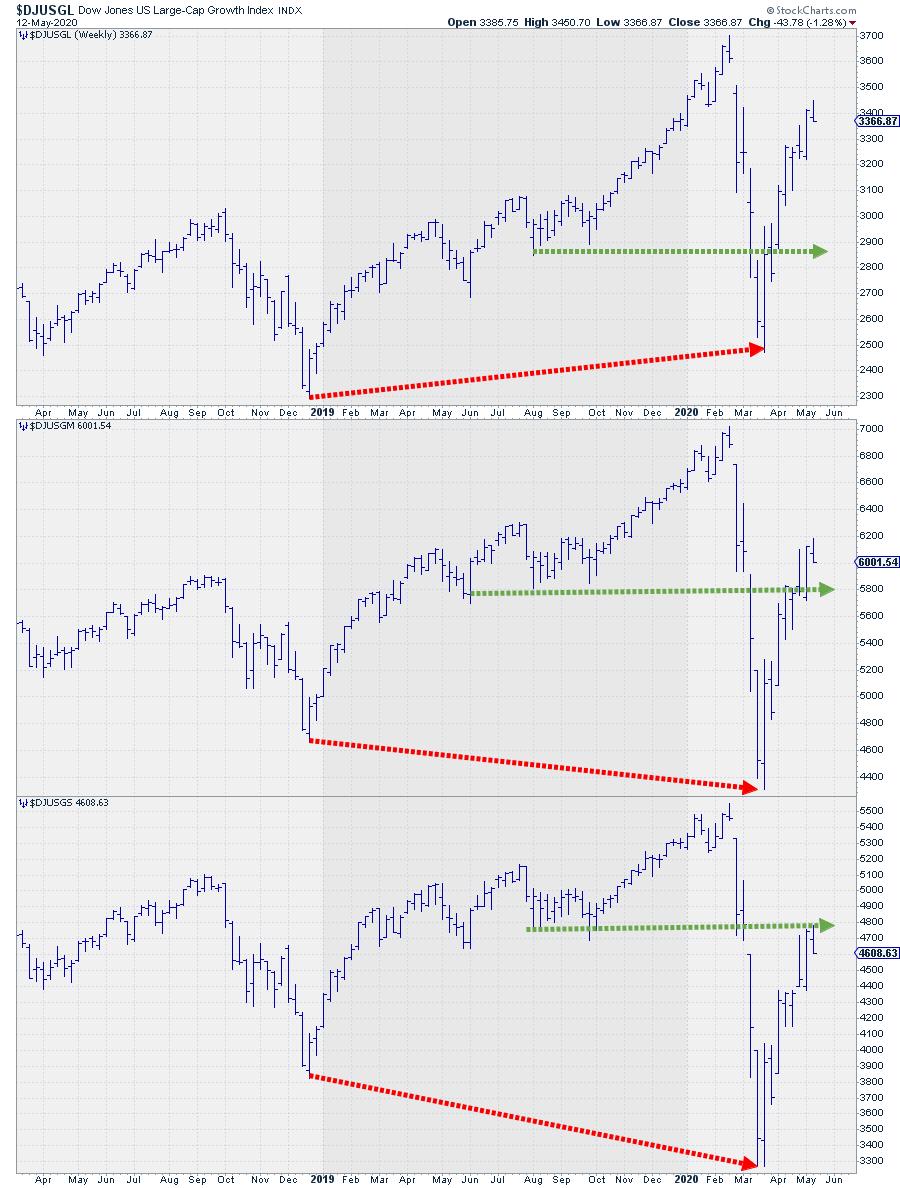
If we line up the charts for these three segments, the differences show very clearly.

Large-cap did not drop below its late 2018 low, but mid- and small-cap did. The recovery out of the March low is well above the August-September lows for large-cap, and a little less, but still above, for mid-cap. Small-cap growth is now pushing against resistance offered by these August-September lows.
Particularly when small-caps are able to push through their resistance level, the rotation in favor of this segment, together with mid-cap, can continue.
#StaySafe,
--Julius
Julius de Kempenaer
Senior Technical Analyst, StockCharts.com
Creator, Relative Rotation Graphs
Founder, RRG Research
Host of: Sector Spotlight
Please find my handles for social media channels under the Bio below.
Feedback, comments or questions are welcome at Juliusdk@stockcharts.com. I cannot promise to respond to each and every message, but I will certainly read them and, where reasonably possible, use the feedback and comments or answer questions.
To discuss RRG with me on S.C.A.N., tag me using the handle Julius_RRG.
RRG, Relative Rotation Graphs, JdK RS-Ratio, and JdK RS-Momentum are registered trademarks of RRG Research.
