RRG Charts May 30, 2019 at 05:36 AM

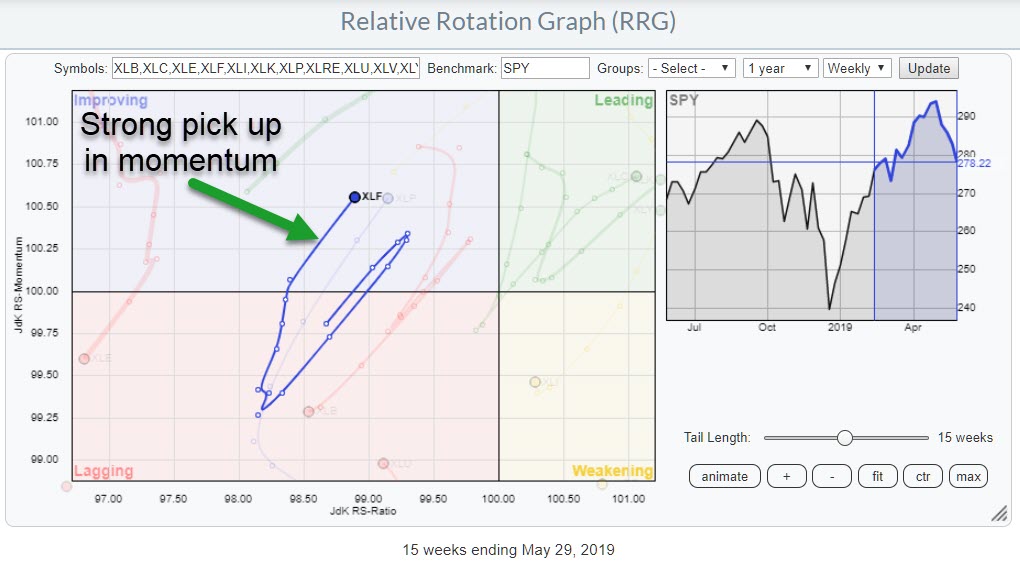
Looking at the Relative Rotation Graph showing the sectors of the S&P 500, we can see that the tail on the Financials sector stands out, having seen a big increase since last Friday... Read More
RRG Charts May 22, 2019 at 12:43 PM

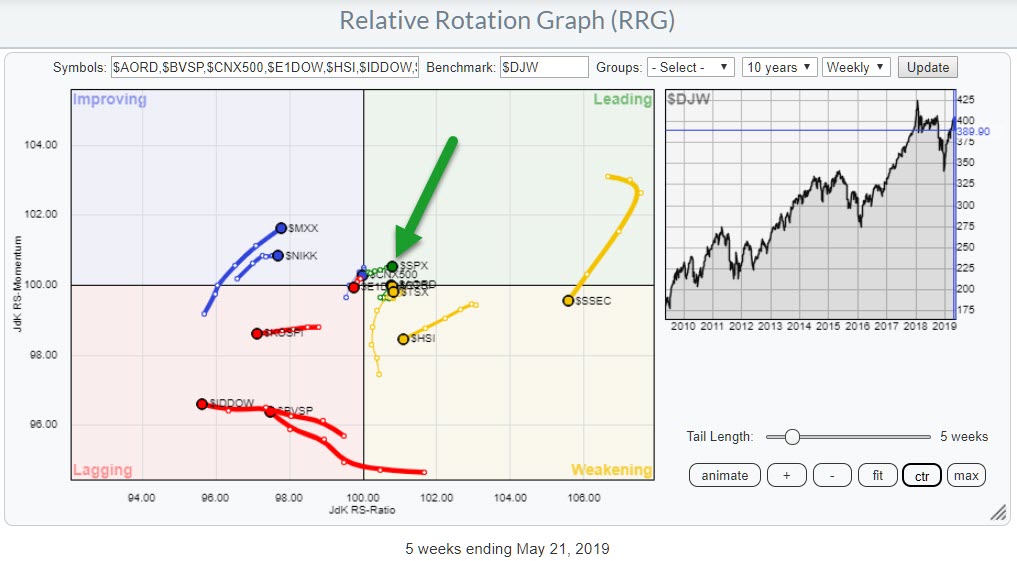
Stock markets around the world are giving mixed signals. Returns over the last 5 weeks have varied from +4% in Australia to -10% in China. The Relative Rotation Graph above shows the relative trends that are currently in play among the various international stock market indexes... Read More
RRG Charts May 14, 2019 at 10:38 AM

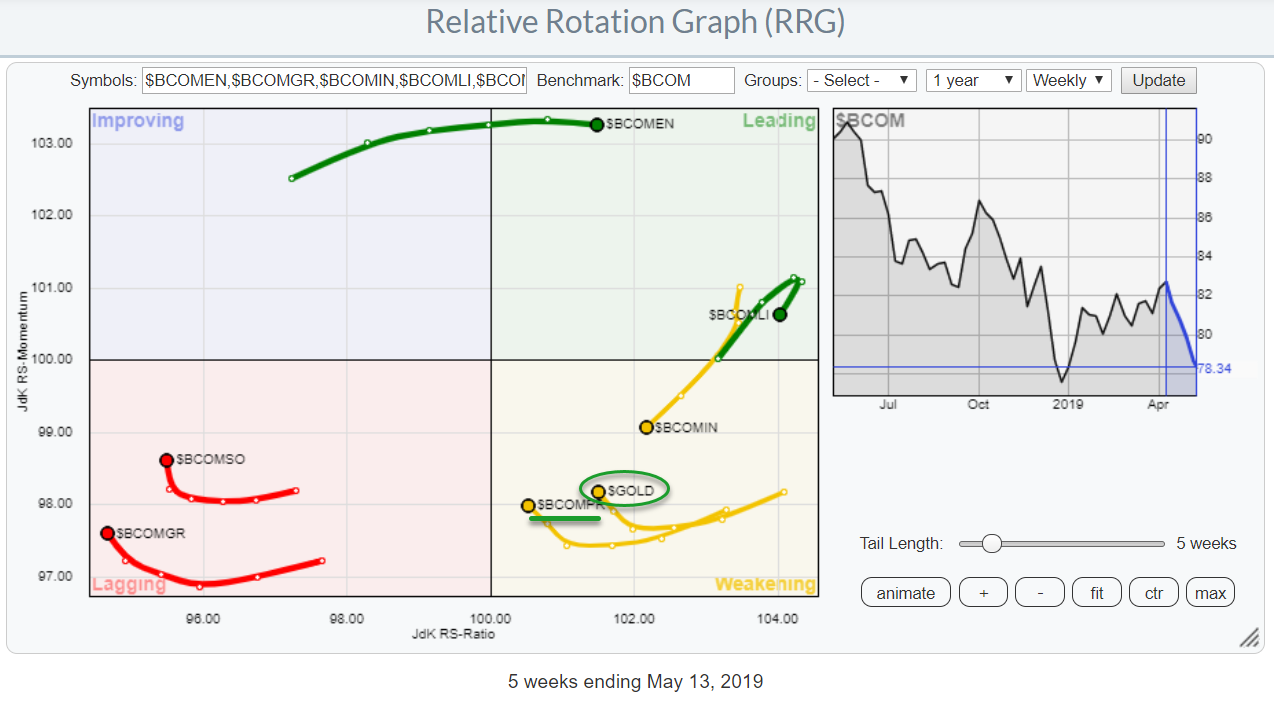
After a struggle with resistance around its previous high of 2940, the S&P 500 index failed to break and started to come down off of its highs... Read More
RRG Charts May 08, 2019 at 10:13 AM

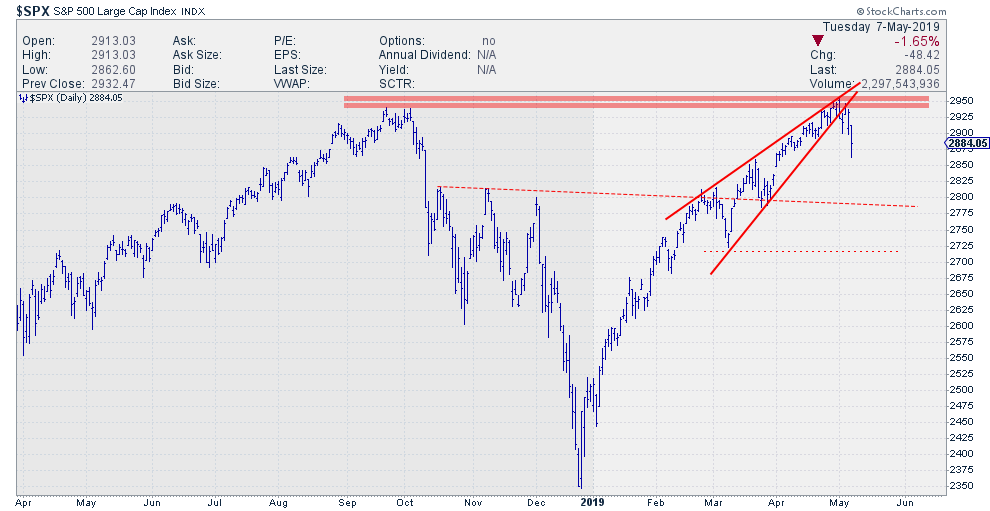
Since printing its high on 1 May, the S&P 500 has struggled to keep up and make its final push through resistance. Over the last three to four days, the bulls have capitulated, putting a reinforcement of the 2940-2950 resistance zone into place... Read More