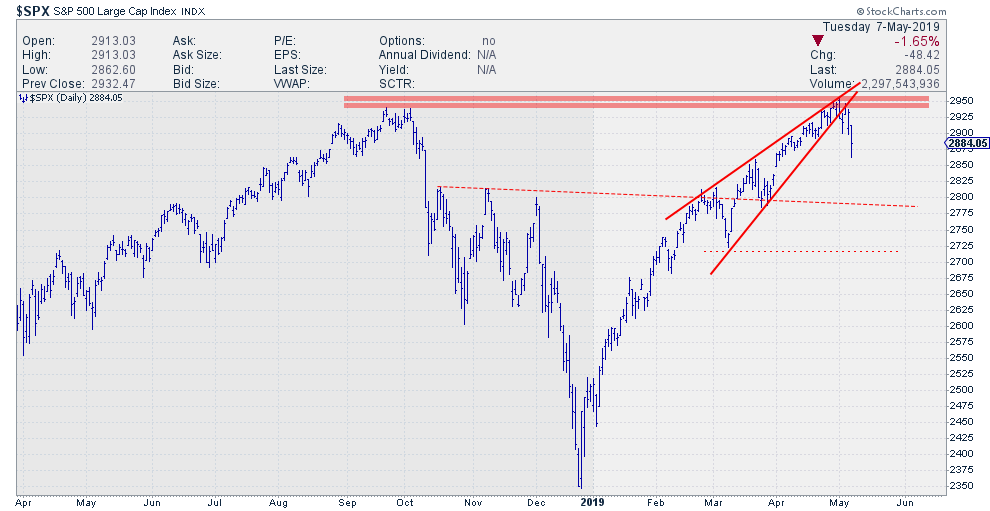
 Since printing its high on 1 May, the S&P 500 has struggled to keep up and make its final push through resistance. Over the last three to four days, the bulls have capitulated, putting a reinforcement of the 2940-2950 resistance zone into place. The rising wedge formation that had been building up since March has now executed.
On the daily relative rotation graph for US sectors, the rotation to the more defensive sectors is now accelerating with Health Care, Utilities and Real Estate all inside the improving quadrant and rapidly heading towards leading at a strong RRG-Heading.
That Wedge in the S&P 500.
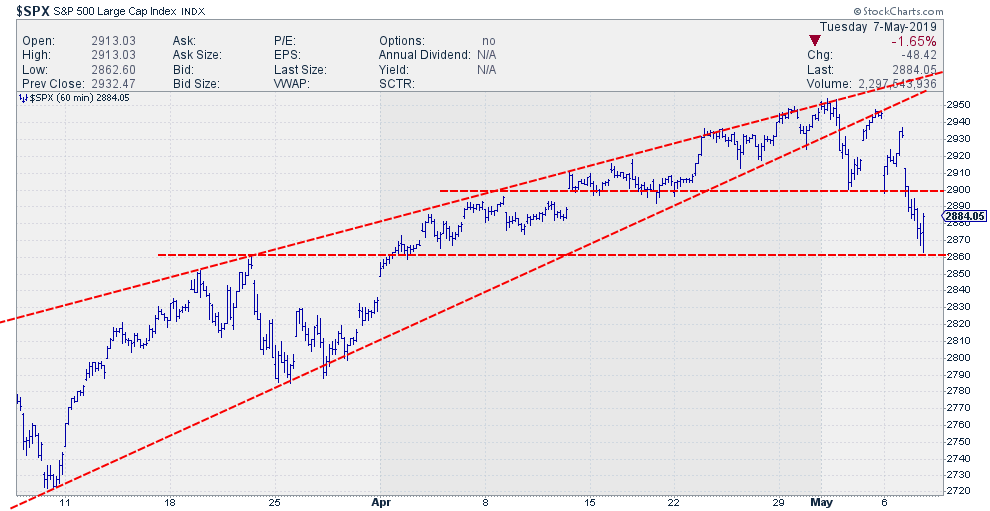
The chart above is an updated and slightly zoomed out version of the chart that I used in my DITC contribution "Are We Looking At A Wedge In The Making?" from 17 April. Now, knowing last week's - and especially yesterday's - price action, I think we can confirm that this wedge pattern has triggered a sell-signal, opening up the way for further correction.
Wedges may not be the most reliable pattern around, but they can least give us some ideas and guidance. Some reasons why I am happy to qualify the current setup in the S&P as a completed (and fairly reliable) rising wedge are:
- The peak of the wedge prior to breaking down coincides with a major resistance level coming off a prior high, which is a resistance level in and of itself. That resistance level has now been tested and proven to be too heavy to break for now, which reinforces that level of resistance.
- The downward breakout of that wedge coincides with the completion of a small double top formation, reversing the recent series of higher highs followed by higher lows into a new rhythm of lower highs and lower lows. Admittedly, that new series is still fragile, but it is there, and reversals are always a bit tricky at the beginning.
- Wedge or no wedge, both observations above are negatives and suggest that we are looking for some more downside ahead in coming days. Only time will tell, but the macroeconomic impact of the current political discussions will very likely add volatility to the markets. That does not make things any easier.
All in all, from a trading/investing perspective, it looks as if the upside is very, very limited for now, not to mention blocked by an overhead resistance barrier that just got a lot stronger, all while the downside is getting more and more exposed.
On the hourly chart below, it can be seen that 2860 served as short-term support where the market bounced towards yesterday's close. 2900 shows up as resistance, while the big barrier is in the range between 2940-2955.
Accelerating Rotation towards Defensive Sectors
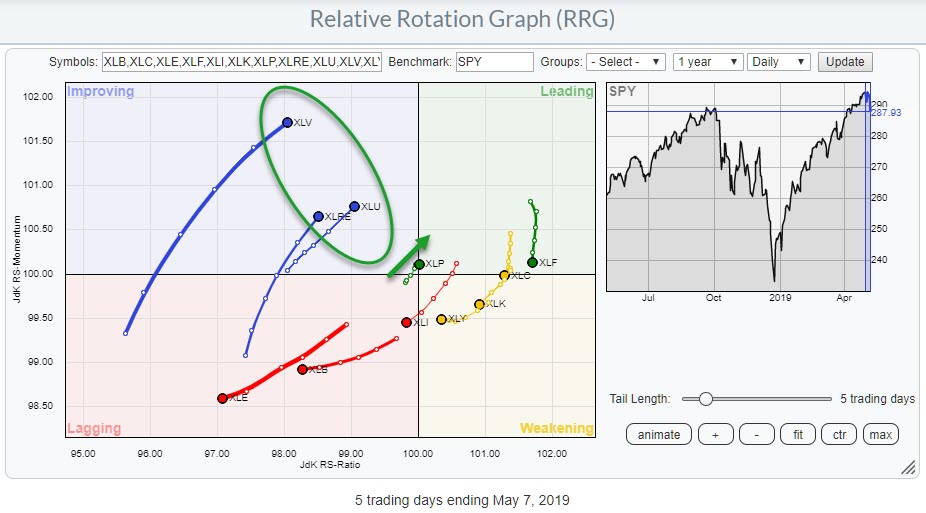 The daily RRG for US sectors is showing a rapid improvement for defensive sectors like Health Care, Utilities and Real Estate. All three are inside the improving quadrant and traveling towards leading at strong RRG-Headings.
The Consumer Staples sector, also one of the classic defensive sectors, is right at the center of the RRG, meaning that its relative trend against SPY has been flat recently, but is now hooking upward into the leading quadrant and accelerating. A strongly zoomed-in RRG, as below, is needed to see that fast rotation on the XLP tail.
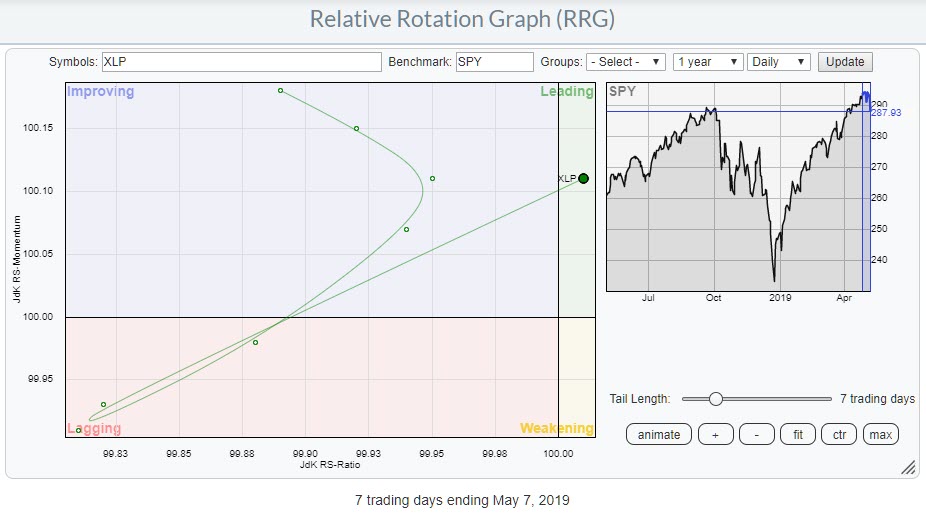 Out of these four sectors, the charts for Utilities and Staples look the most promising IMHO.
Health Care is pushing against resistance in price AND relative and just had a big momentum run that is at risk of rolling over.
Real Estate is in a trading range on both the price and the relative charts; this sector should be able to break beyond its former relative highs in order to unlock serious relative upside.
For the time being, I am keeping an eye on Utilities and Staples.
Utilities
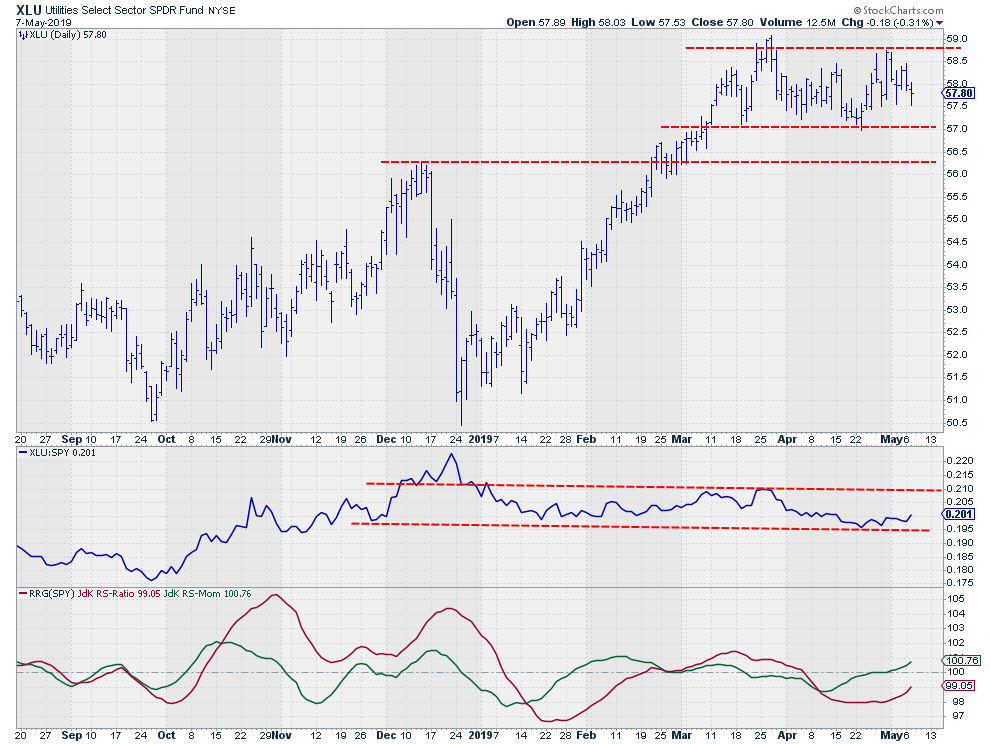
The keen observer might say: "Hey, what about the Utilities sector? Isn't it also in a trading range on both price and relative charts, just like Health Care?" That is true, but the big difference is that Utilities broke to new all-time highs in March and are now consolidating just above that former resistance level, now support, which makes for much easier movement to the upside than the downside.
Also, Utilities is at the bottom of its range on the relative chart, which creates some relative upside. When price manages to get above those recent highs around $59, I expect relative strength to follow.
Staples
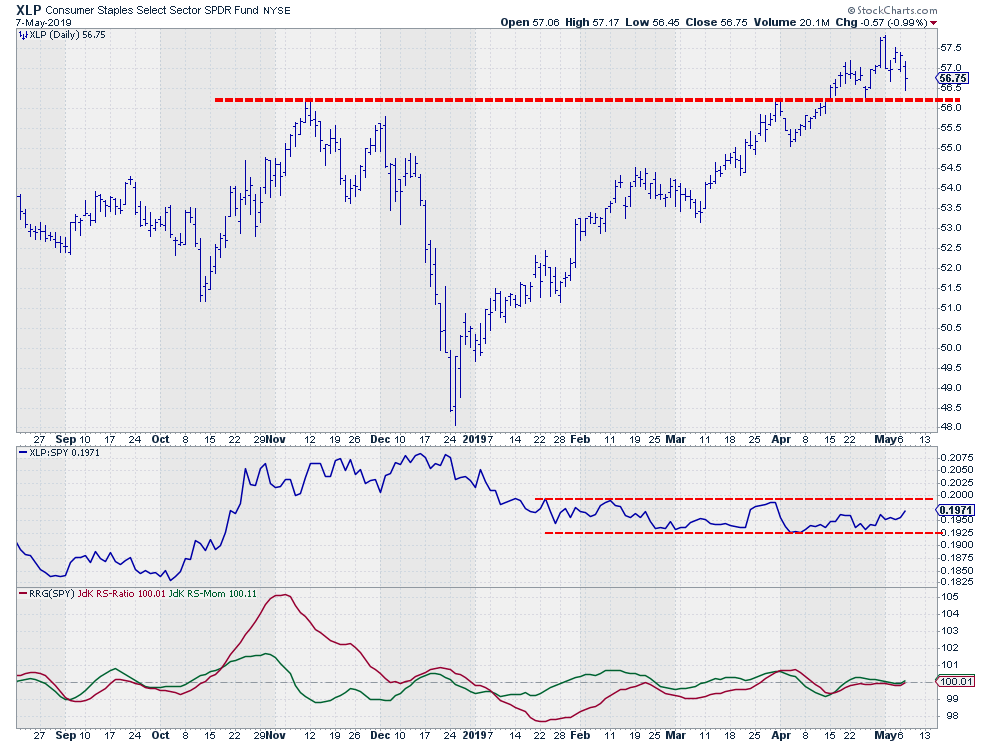 A similar situation, albeit less of a range in the price chart, goes for Staples. This sector also broke to new highs and, so far, has been able to keep up above that breakout level, which is definitely a sign of strength considering the rest of the market is moving lower.
With their tails inside the improving quadrant but still at relatively low JdK RS-Momentum levels (meaning there is plenty of room for more), I prefer Staples and Utilities as (overweight) holdings in a portfolio over Health Care and/or Real Estate.
Let me know what you think of this usage of RRG in the comments below. If you would like to receive a notification when a new RRG blog article is published, simply subscribe with your email address using the form below.
Julius de Kempenaer
Senior Technical Analyst, StockCharts.com
Creator, Relative Rotation Graphs
Founder, RRG Research
Want to stay up to date with the latest market insights from Julius?
– Follow @RRGResearch on Twitter
– Like RRG Research on Facebook
– Follow RRG Research on LinkedIn
– Subscribe to the RRG Charts blog on StockCharts
Feedback, comments or questions are welcome at Juliusdk@stockcharts.com. I cannot promise to respond to each and every message, but I will certainly read them and, where reasonably possible, use the feedback and comments or answer questions.
To discuss RRG with me on S.C.A.N., tag me using the handle Julius_RRG.
RRG, Relative Rotation Graphs, JdK RS-Ratio, and JdK RS-Momentum are registered trademarks of RRG Research.

