 I’ve analyzed over one million charts. That’s not bravado, just math. A hundred to two hundred charts a day (most days) for over 25 years, and that’s the number you reach. I share this because chart reading practice has indeed allowed me to train my eye in such a away that it allows me to wring an astonishing amount of information from a one-page chart. Cultivating these skills is what this bi-weekly “Action Practice” blog is all about.
For those of you who might have stumbled upon this as your first exposure to these “action practice” blogs, think of this as paper trading, visual investing or virtual trading exercises. Might I suggest you revisit the September 2, 2016 blog where I explain my objectives in more detail.
This current blog, however, presents my analysis of the charts I offered you in the November 11, 2016 blog.
http://stockcharts.com/articles/journal/2016/11/charts-im-stalking-action-practice-6.html
So dig out your analysis from then, and let’s get to it. Our candidates were Capella Education (CPLA), New Oriental Education (EDU), TAL Education (XRS), and Strayer Education (STRA).
- The first observation is that we are looking at four Sister Stocks. All these equities are in the educational space. The stock market loves hot groupings. This is clearly a hot group which the institutions have deemed as worthy of serious money flow.
- All four equities are either breaking out into a new high or very close to it.
- Two are Chinese companies; two are American. The Chinese companies are in an uptrend, whereas the USA equities (CPLA and STRA) are more akin to breaking out of a trading range. Remember, we are looking for equities with the most upside potential from the present date.
- An analysis of the Point & Figure charts and their upside count yields more favorable risk/reward probabilities for the two American equities versus EDU and XRS.
- I must confess that I picked four rather unique choices, based more on potential analysis lessons than because these charts were the “best” from a collection of outperforming education stocks (more on this later).
- Unlike other weeks, I’ll not dig into earnings and fundamentals. This is purely a technical Action Practice episode.
- When you load all four equities on a Perf Chart, it is also obvious that XRS and EDU (the Chinese equities) are underperforming both the S&P 500, as well as their USA sisters(CPLA and STRA).
- Note, too, that there is not a specific DOW Industry Group for education stocks. These stocks are embedded as part of Specialized Consumer Services ($DJUSCS) which includes many non-sister equities. Yes, the market loves groupings. However, as an investor, you must appreciate the composition of these groupings. As in this situation, being assigned to the same industry group does not automatically make it a Sister stock per our definition.
- What caught my attention in early November was that five Sisters, all in the education space, were outperforming the S&P 500. In actuality, Bridgeport Ed (BPI), Career Education (CECO) and Devry (DV) were outperforming STRA and CPLA The reason I used STRA and CPLA was that they provided a better teaching opportunity. In reality, BPI, CECO and DV were more profitable trades.
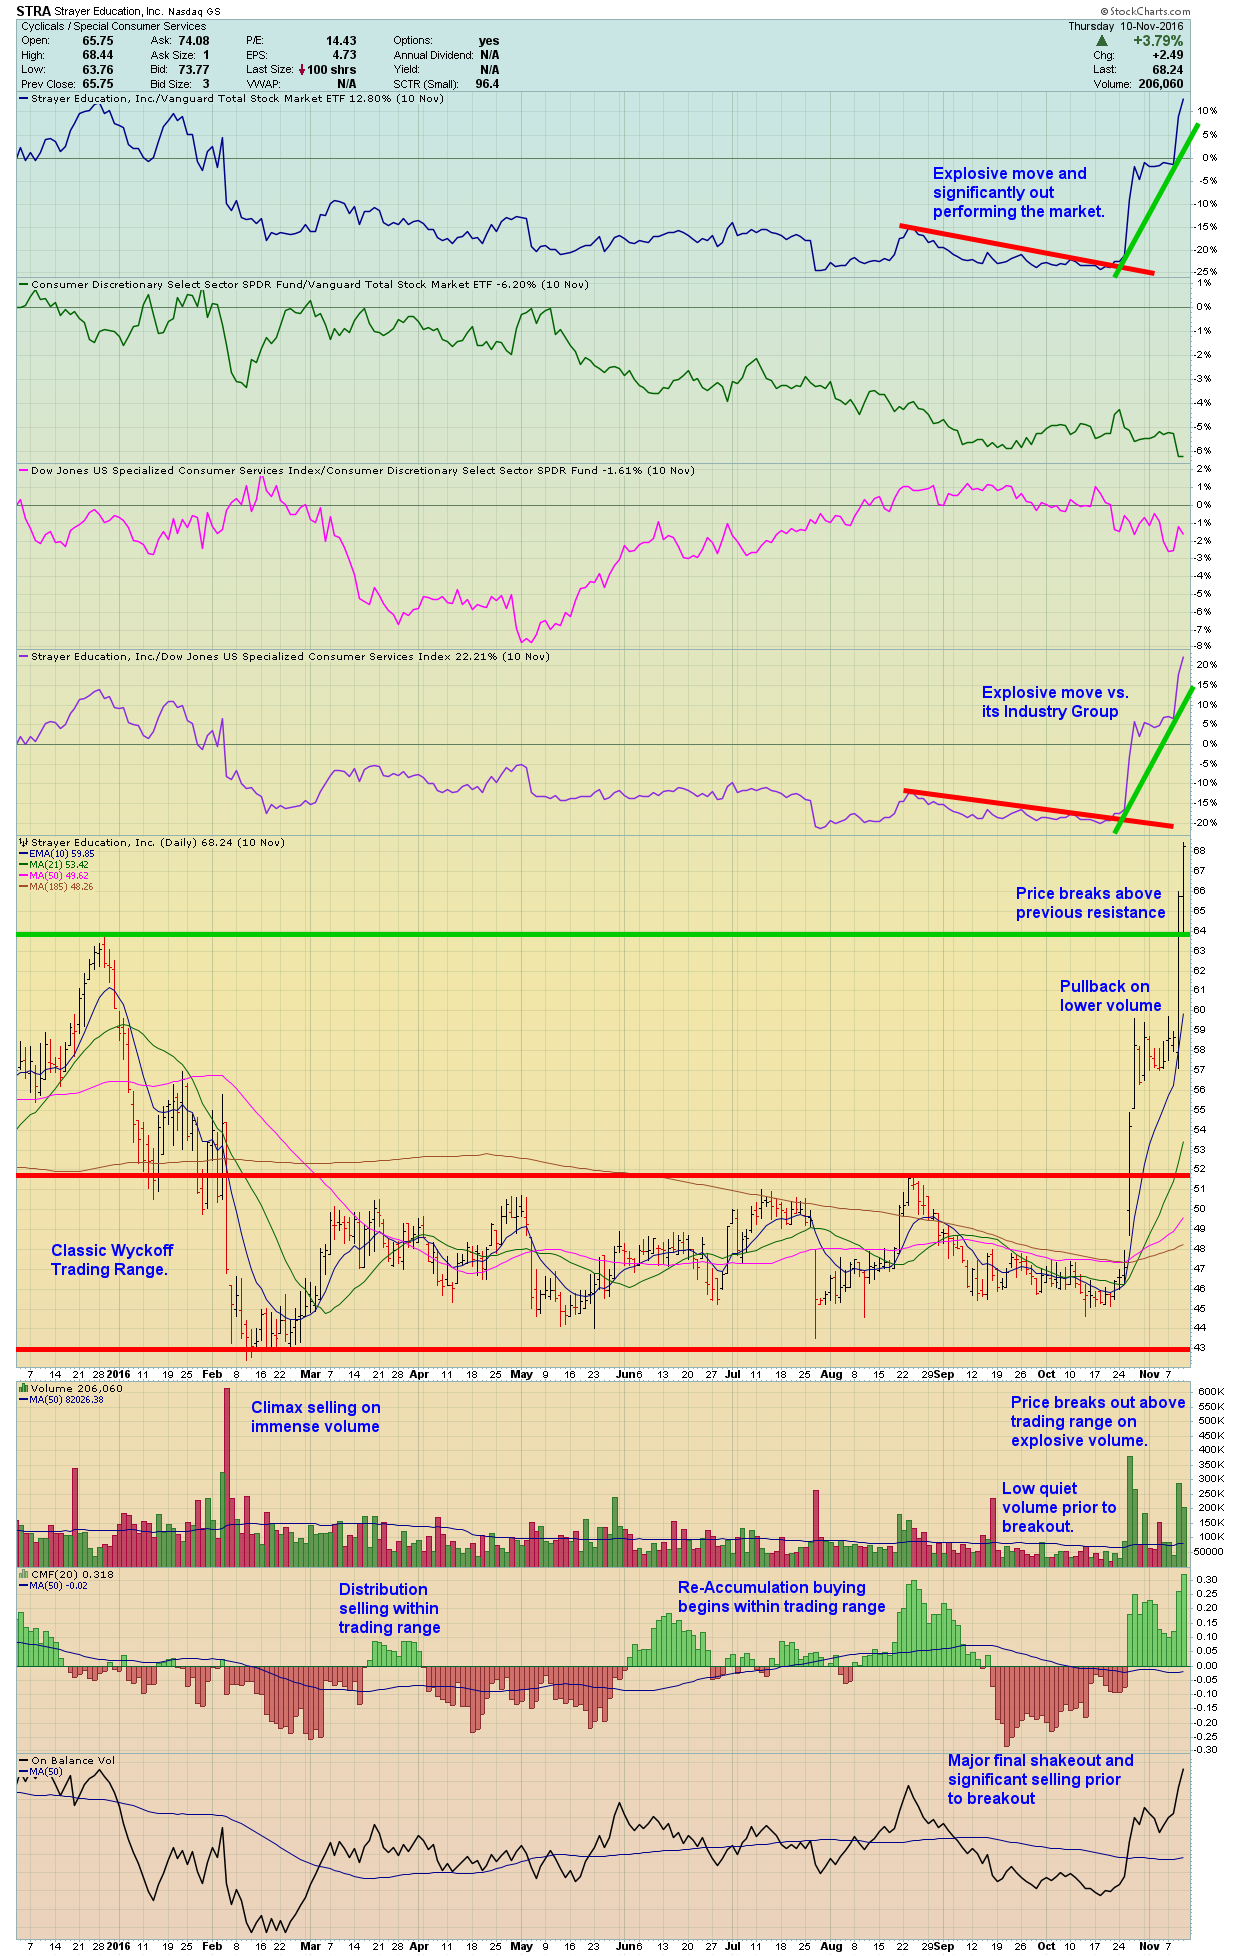
- Of the four Action Practice candidates I presented to you on November 10, 2016, Strayer Ed (STRA) is the most attractive candidate back on November 10, 2016 because of a nice Wyckoff setup. Notice the climax selloff in February on high volume. Then the stock moves sideways for four months as distribution and negative money flow moves the stock from weak hands to strong hands. Notice how accumulation begins in earnest in June, while STRA continues to trade sideways. Eventually, in September/ October, the weak hands finally throw in the towel and sell the remainder of their stock, subsequently the volume gets very quiet just prior to the upside breakout. This signals that the sellers have been exhausted. The strong hands have vacuumed up all the stock from the weak hands, and STRA is off to the races. The probabilities look good. Check out this chart.

New Action Practice Chart:
This week’s Action Practice exercise is unlike any before. The objective of this exercise is for you to dial in and identify your personal tolerance for risk, volatility and drawdowns. There is no right or wrong answer. The operative word here is personal.
I’m going to ask you to do this exercise three times. On three different days, at three different times of the day and in three different frames of mind. Each time, write down your personal conclusions and observations.
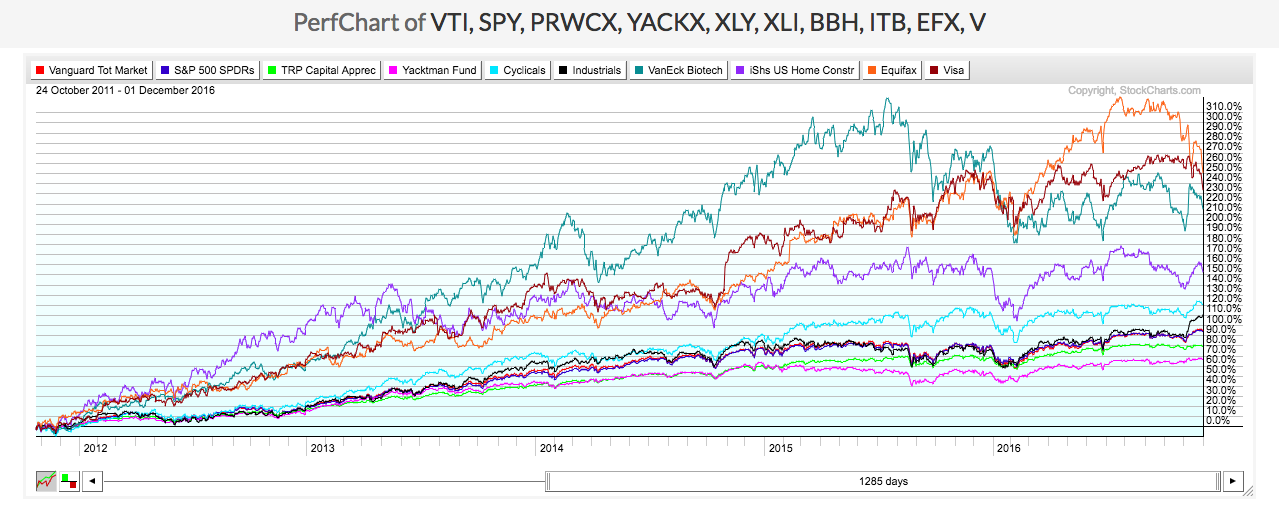
What I’ve done is to have installed ten (10) ticker symbols into a PerfChart that represents the five major stock market segments:
- Indexes (VTI, SPY)
- Mutual Funds (PRWCX, YACKX)
- Sector ETFs (XLY, XLI)
- Industry ETFs (BBH, ITB)
- Individual Stocks (EFX, V)
By adjusting the horizontal timeframe bar on the PerfChart, you are creating a visual animation of different returns over different durations with corresponding drawdowns.
Your objective over the three practice sessions is to identify the balance and your tolerance between your personal fear (of drawdowns) versus your greed (percentage returns and profits). Feel free to substitute other ticker symbols you deem perhaps more appropriate to you personally.
I’ll say no more for now. I look forward to hearing about your visual “ahhhh” moments!

Trade well; trade with discipline!
- Gatis Roze
- Author, Tensile Trading: The 10 Essential Stages of Stock Market Mastery (Wiley, 2016)
- Presenter of the best-selling Tensile Trading DVD seminar
- Presenter of How to Master Your Asset Allocation Profile DVD seminar
- Developer of the StockCharts.com Tensile Trading ChartPack
