 Far too many investors get it wrong, and perhaps no other group more so than the Millennials. In a recent cover page article on the investing habits of the Millennial generation, IBD reported that Index ETFs are the investment vehicles of choice for these 19 -35 year olds. I maintain that this is foolish and simply the result of the young investors not being aware of the powerful decision tools that are available to them.
I have personally discovered that the sweet spot with investing is to have a truly accurate understanding of your own tolerance for the markets’ inevitable pullbacks and drawdowns. Most fundamentalists approach this problem with a static model that considers standard deviations, beta,percentage drawdowns or some numerical gauge. The reality of investing, however, is that we each have completely unique tolerances for risk and reward. This is precisely how it should be.
We are all different ages with different investing horizons. We each tolerate drawdowns differently and have different financial needs and objectives, not to mention beliefs about whether Social Security will be there when we retire. Finally, we all have varying amounts of passion with respect to managing our investments, as well as the time available to allocate to the effort.
For all these reasons, I believe it is so very important to make an effort to identify your personal risk and reward profile. This blog is about just this challenge. We must all attempt to understand how much are we willing to lose before we throw in the towel versus our expected upside rewards and profits? This individual balance between fear and greed is what will determine your long term success as an individual investor.
Here is where the Millennials have been totally misled by blindly embracing indexing as their investment vehicle of choice. I maintain it’s because they do not realize that a powerful tool exists to help them properly identify their personal risk and reward balance, and have therefore not made an effort to evaluate their own needs and produce a unique individual profile.
With respect to the five market segments, the conventional understanding is that as you target higher returns, you’ll experience larger drawdowns. A classic Faustian bargain. If you require higher rewards, you’ll have to embrace higher risks.
The five segments I’ll use for this example are the following:
1. Balanced Mutual Funds containing both stocks and bonds, i.e. PRWCX and VWIAX. Thought to produce lower returns than indexes, but with small drawdowns.
2. Index Funds, i.e. S&P 500 ( SPY) and Vanguard Total Market (VTI). You achieve market rewards and experience market drawdowns.
3. Sector Funds, i.e. Consumer Discretionary / Cyclicals (XLY) and Industrials (XLI). Returns generally exceed market indexes, albeit with more volatility, larger drawdowns and some buying and selling exchanges being required.
4. Individual Industries, i.e. Biotech (BBH) and Home Builders (ITB). Another step up the rewards ladder with increased volatility.
5. Individual Stocks, i.e. Equifax (EFX) and Visa (V). Returns can be truly astronomical along with volatility and drawdowns.
A static risk/reward model cannot accurately unearth our individual fear and greed tolerances. The only way I know that an investor can truly arrive there is by using this PerfChart which allows them to visually animate the actual historical drawdowns and shows the historical rewards of each of five different segments over various durations. The essential question every investor must be willing to address is duration. Returns vary (as do drawdowns) depending upon your holding period and investment horizon.
The PerfChart allows one to easily vary the duration to align with the appropriate stage of life you find yourself presently. Therein lies the millennial faux pax. Their youth allows them to absorb more risk (drawdowns) because their investing horizon is much longer. Consequently, history shows us that they’ll be rewarded with much higher returns for their longer time horizon.
I believe this animation tool will convince Millennials that they can indeed absorb more risk and the commensurate rewards are something they’ll gladly embrace. They will see for themselves that Index ETFs are silly for them. Older investors may come to different conclusions, but for all investors, this animation exercise performed over multiple days, multiple moods and different times of the week will identify the most appropriate individual risk/reward ratio possible.
I also believe this tool is essential in constructing one’s asset allocation profile. Each of the 59 Asset Classes described in our book and DVD can be plotted in the PerfChart to better help you visually identify historical correlations (when one asset class moves up, another asset class moves down) amongst asset classes as well as build an appropriate model to reflect your percentage of core versus explore investments.
It’s been my personal experience that discovering my own risk/reward profile in the manner I’ve described uncovered the investing sweet spot which allowed me to build a balanced portfolio that comfortably fits my risk/reward tendencies. Try it yourself — especially those of you who are Millennials — and I wager you, too, will come to the same conclusion.
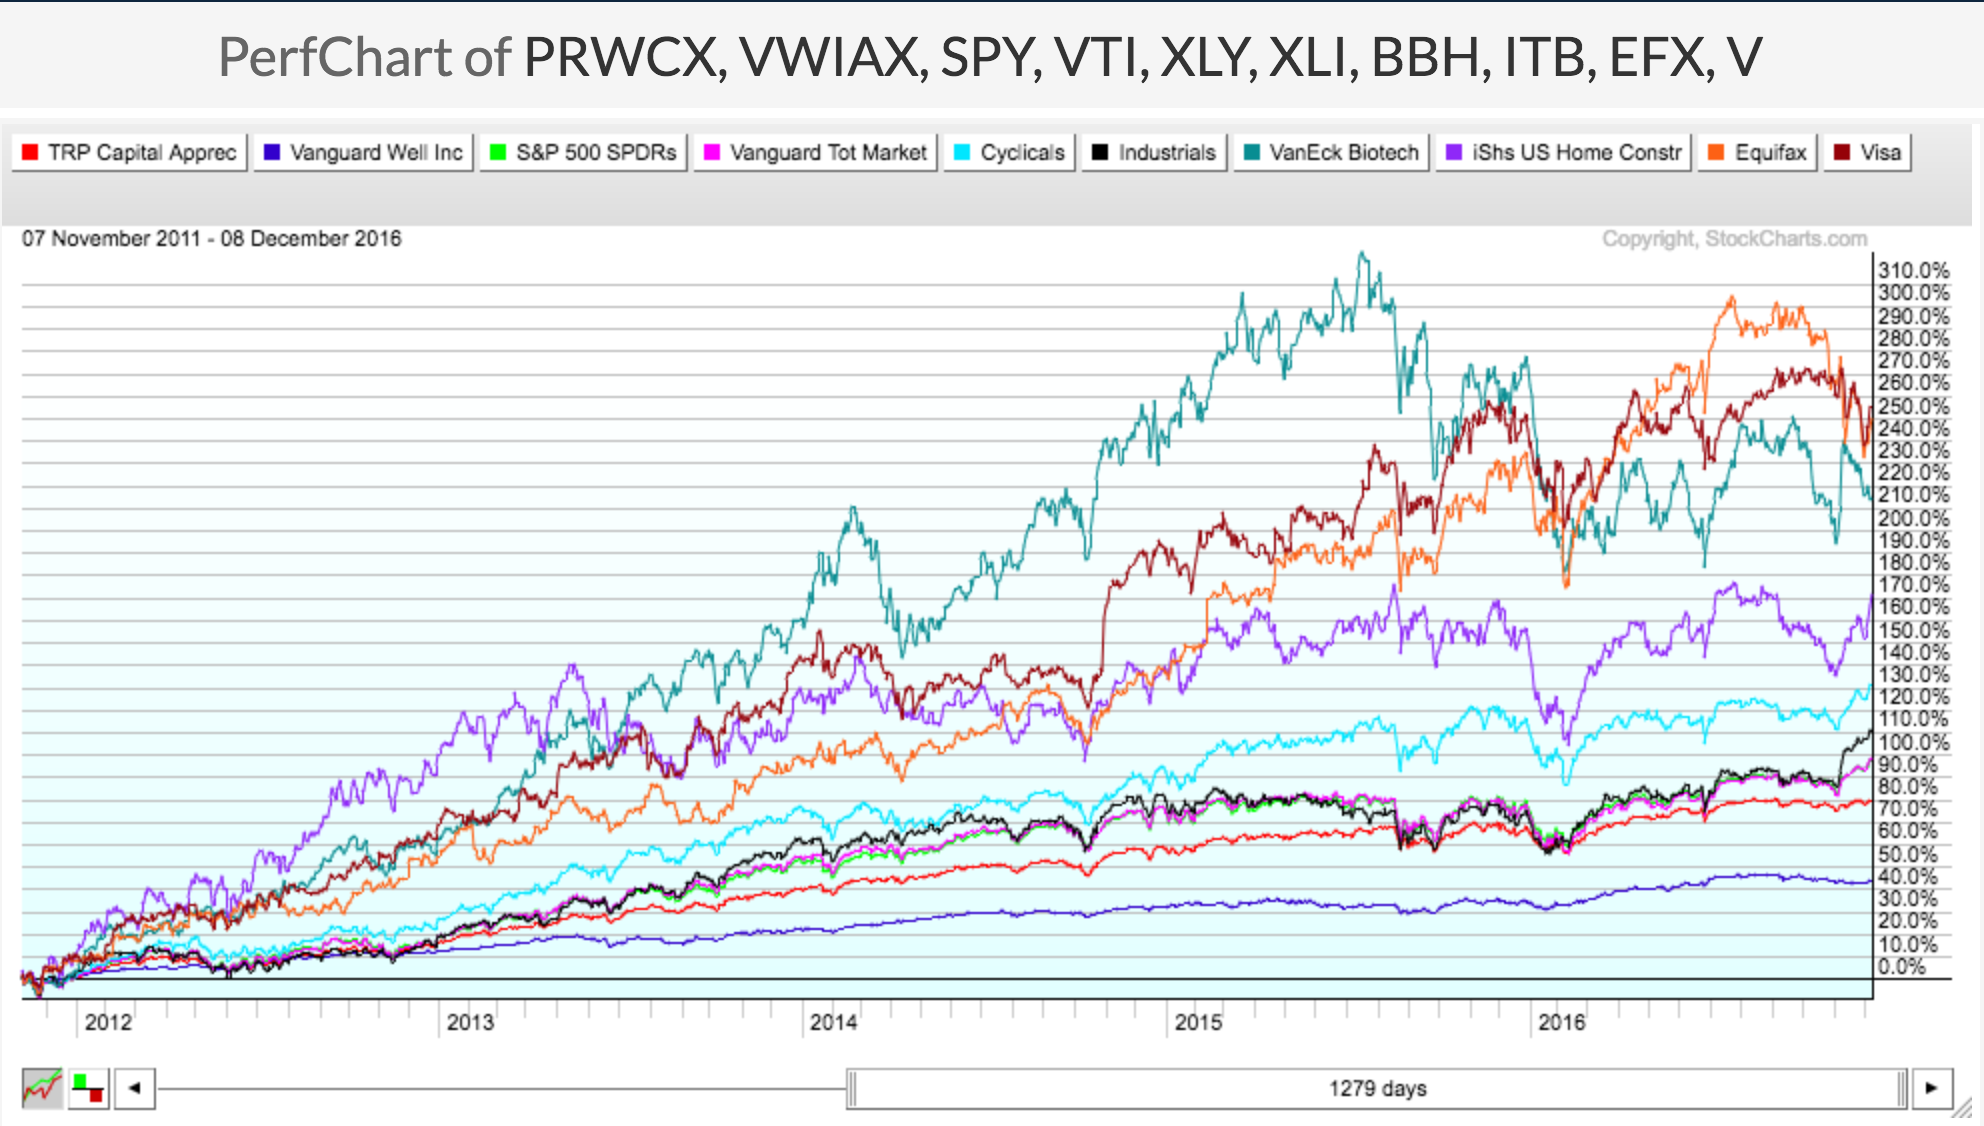
Chart 1:

Note that we are looking at approximately the past five years of performance for our five market segments, and the returns align exactly as we expect.
• Stocks: Visa (V) up +256% and Equifax (EFX) up +248%
• Industry Groups: Biotech (BBH) up +220% and Home Builders (ITB) up +170%
• Sectors: Cyclicals up +132% and Industrials (XLI) up +111%
• Indexes: S&P 500 (SPY) up +98% and VTI up +98%
• Balanced Mutual Funds: PRWCX up 80% and VWIAX up +44%
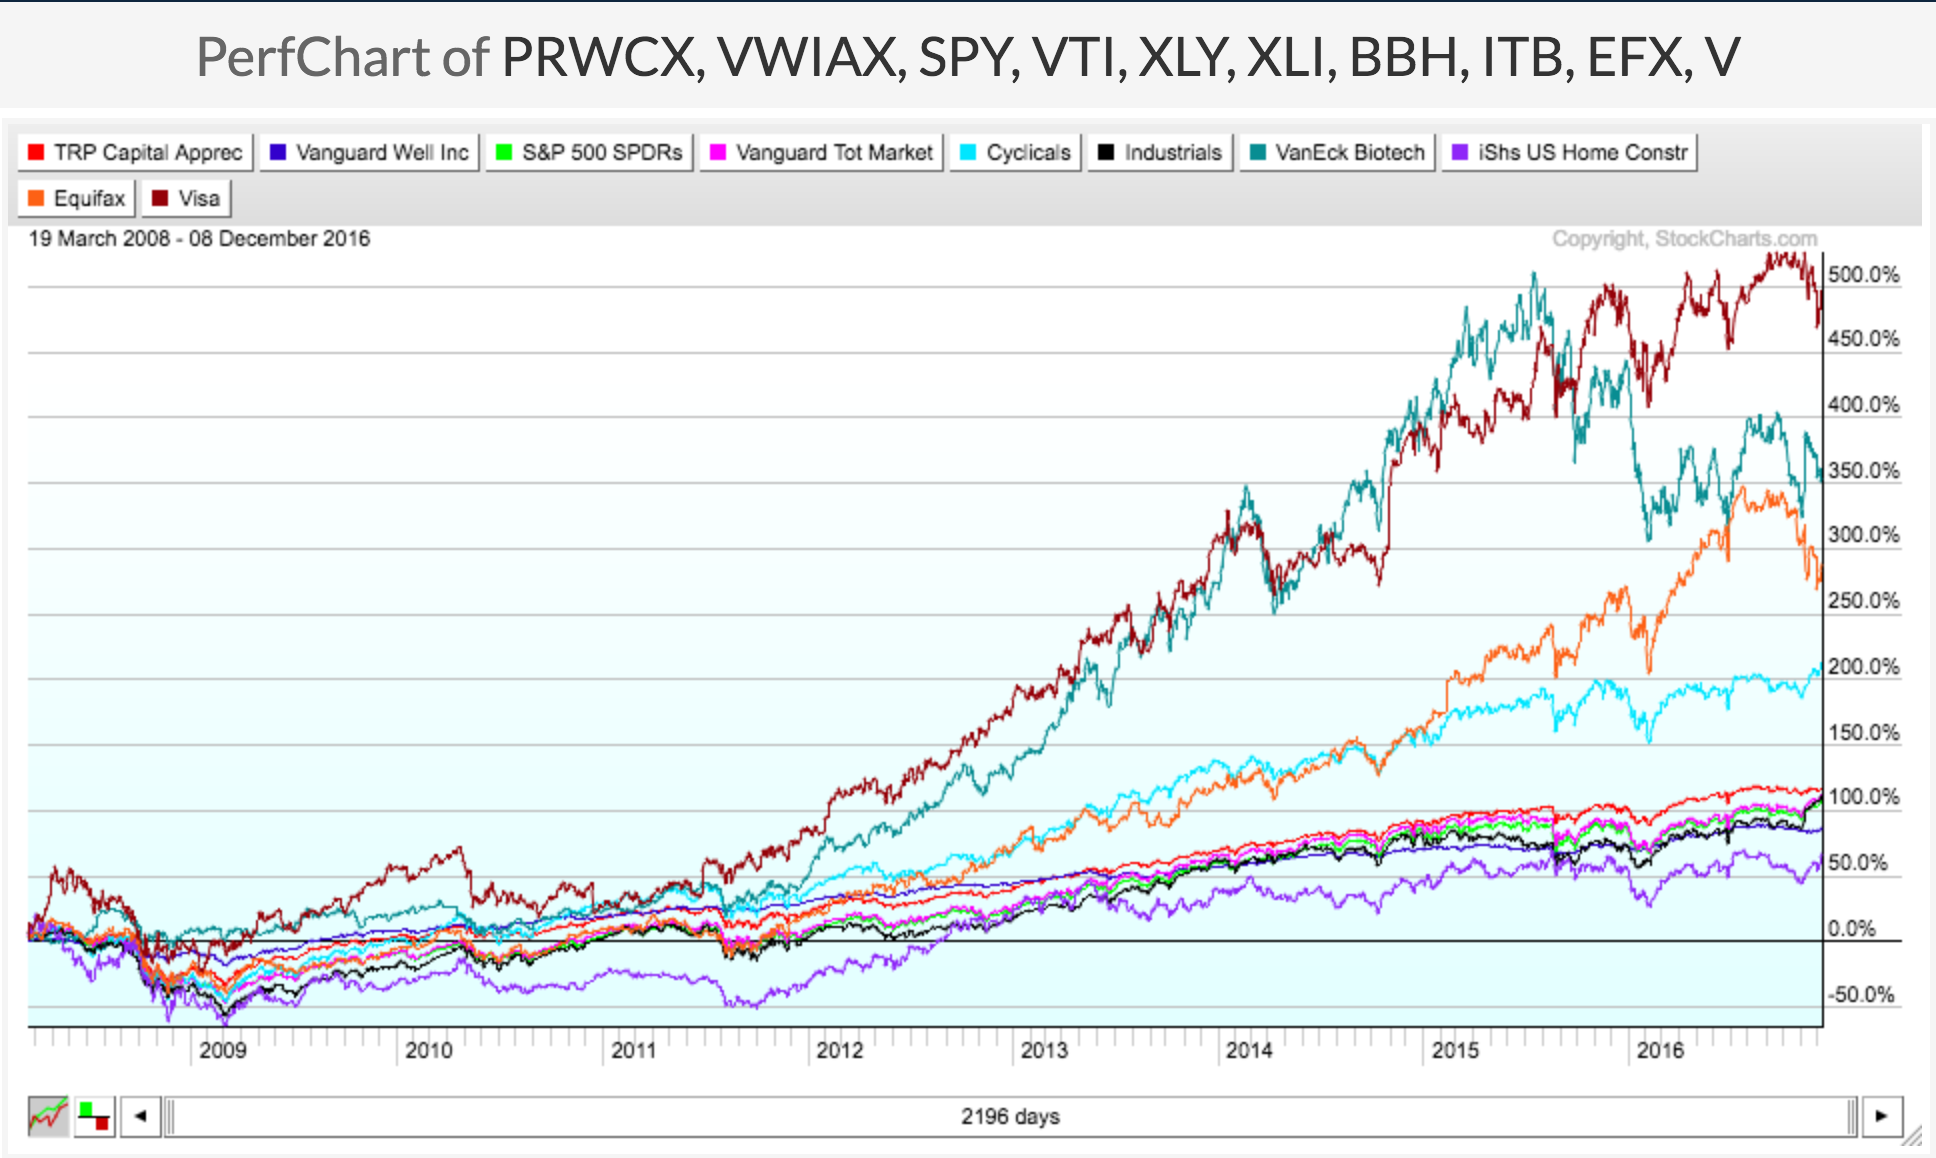
Chart 2:

Now extend the duration and look at what happens. If your time horizon can be extended to nearly nine years, the picture changes a great deal.
• Stocks: Visa (V) up 667%
• Industry Group: Biotech (BBH) up +345%
• Balanced Mutual Funds: PRWCX up 114% and it outperforms the Industrial Sector (XLI), both Indexes (SPY and VTI), and Home Builders (ITB)
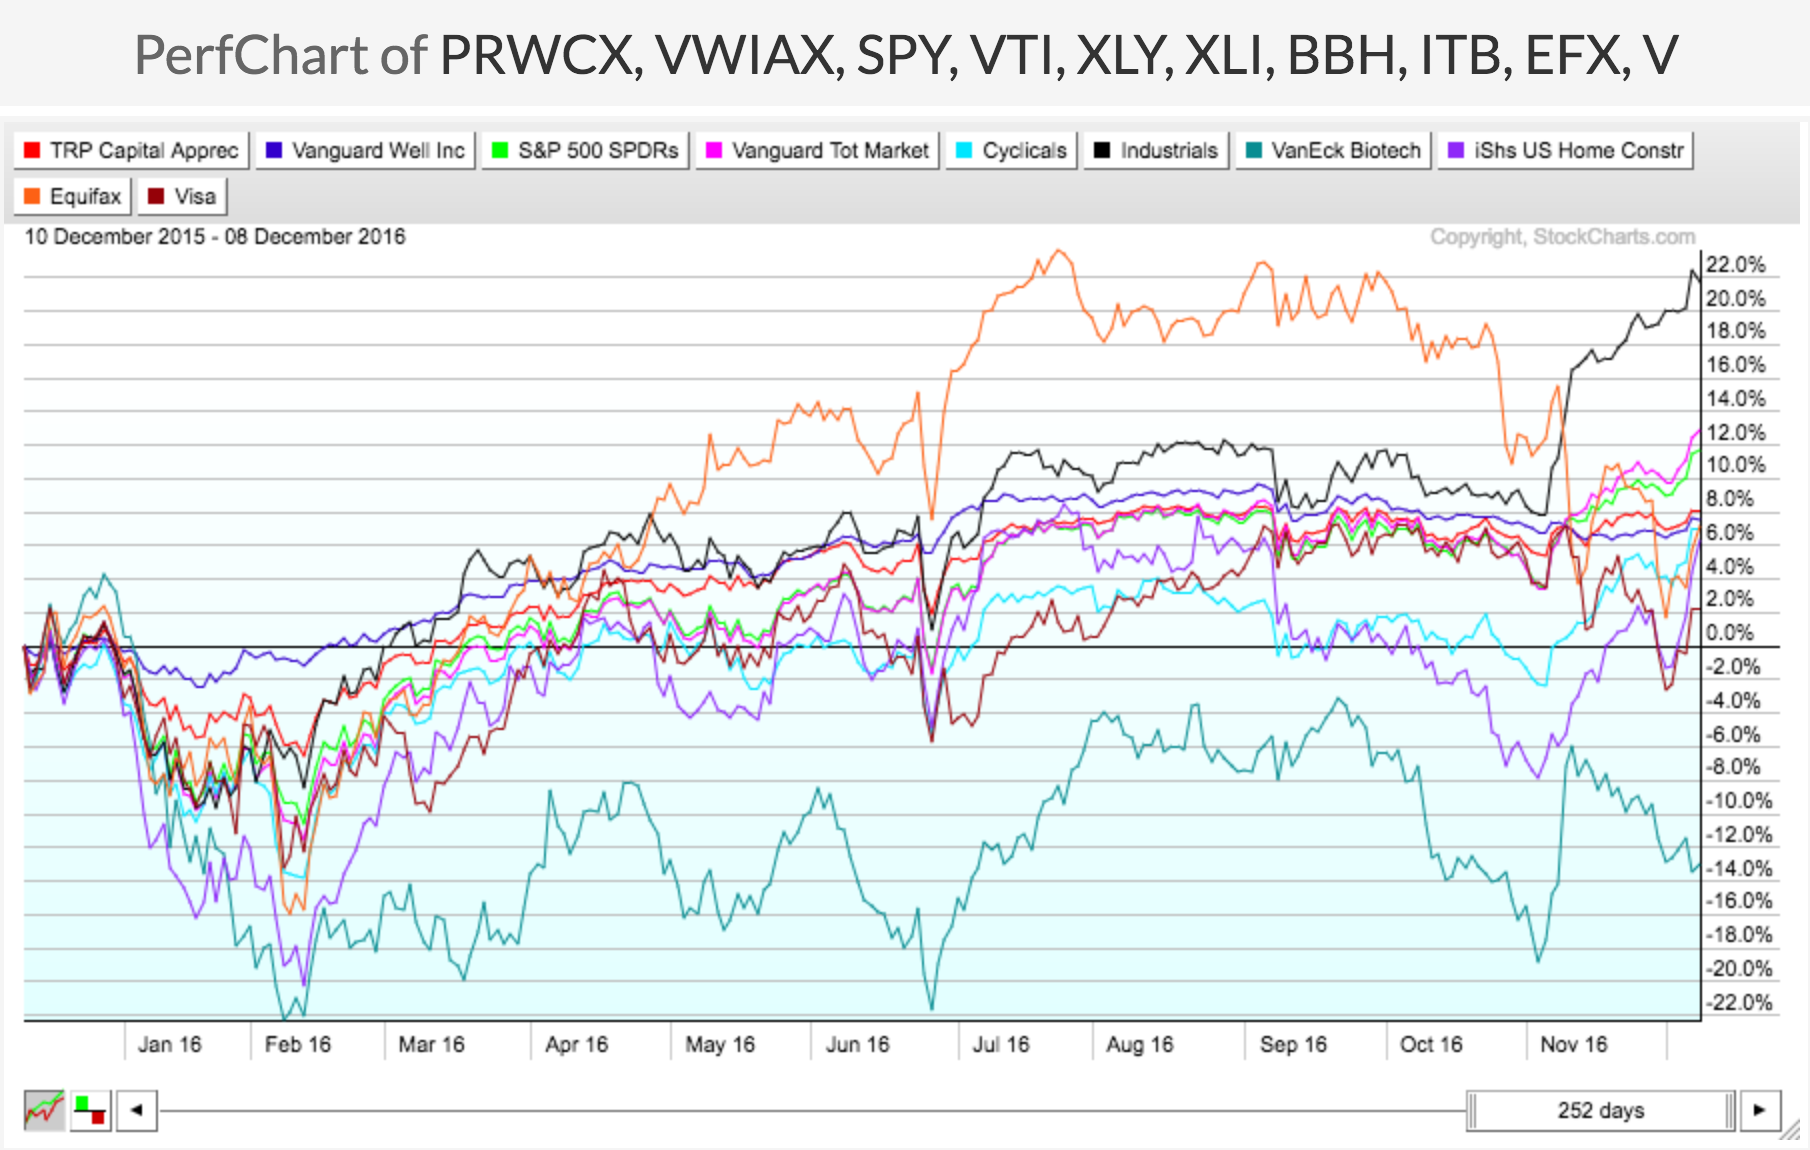
Chart 3:

If your personal investing time horizon is one year in duration, the risk/rewards picture changes significantly.
• Sectors: Industrials (XLI) up 22%
• Indexes: VTI up 12% and SPY up 11%
• Balanced Mutual Funds: PRWCX up 8% and VWIAX up 7%
• Industry Group: Biotech (BBH) down -12%
The bottom line is that Millennials with a longer time horizon can outperform the Indexes. In our example of nine years, Visa (V) up 667% and Biotech (BBH) up 351% outperformed SPY and VTI which were each up only 101%. In other words, these equities outperformed the Indexes by a whopping 350 - 600 percent. Millennials have time on their side and can recover from deeper drawdowns. I suspect most of them would (and should) pursue this strategy if they used the PerfChart tool to uncover their own unique risk/reward profile.
Trade well; trade with discipline!
- Gatis Roze
- Author, Tensile Trading: The 10 Essential Stages of Stock Market Mastery (Wiley, 2016)
- Presenter of the best-selling Tensile Trading DVD seminar
- Presenter of How to Master Your Asset Allocation Profile DVD seminar
- Developer of the StockCharts.com Tensile Trading ChartPack
