A couple of days back, the NIFTY marked a classical Double Top at the 11760 level. The benchmark index has halted its up move and can be seen consolidating just below that level. Over the coming days, the markets are expected to remain highly stock-specific. Right now, ULTRACEMCO.IN deserves some attention.
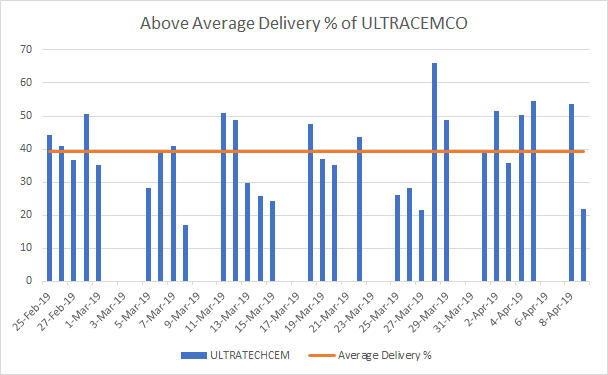
 If we analyze the data of previous 6 weeks, ULTRACEMCO has seen an average of 38% of its total volumes being marked for delivery. Over the past several sessions, we have seen the delivery percentage figure going much higher than its average.
The higher the percentage of Deliverable Quantity compared to Traded Quantity, the better, as it indicates that most buyers are expecting the price of the share to go up.
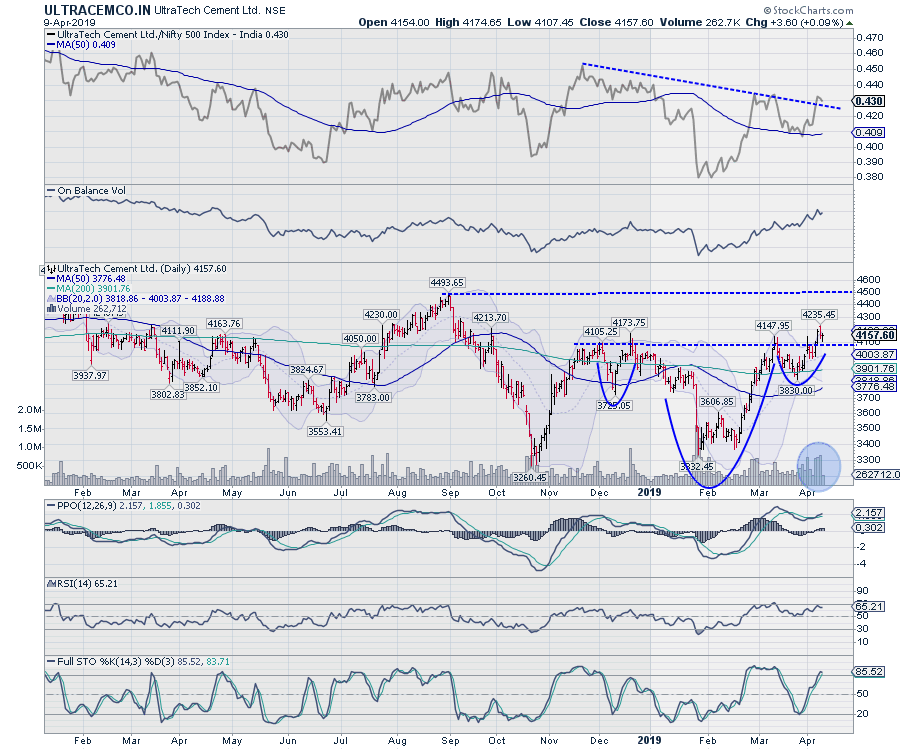
 The daily chart of ULTRACEMCO.IN show a complex head-and-shoulders formation. Though not a classical one, this formation has provided a buoyant setup for the stock. The attempt to move past the neckline has come with increased volumes, which themselves have come with higher percentage of total volumes marked for delivery. This is a buoyant sign.
As the stock moved above its neckline, the OBV has continued inching higher. The daily MACD is in continuing buy mode while PPO is positive. The RS Line has changed its trajectory and is moving higher. The higher timeframe charts also show the RS Line moving higher (and above its 50-Week MA) when benchmarked against the broader CNX500 index.
The stock has shown a minor throwback after an attempted breakout. If any upward move is seen, the stock will test the 4500-4550 zone over the coming weeks. From the current level of 4157, the stock can potentially return ~8-10% over the coming weeks. Any move below 4000 will be negative for the stock.
Milan Vaishnav, CMT, MSTA
Consulting Technical Analyst
www.EquityResearch.asia
Disclosure pursuant to Clause 19 of SEBI (Research Analysts) Regulations 2014: Analyst, Family Members or his Associates hold no financial interest below 1% or higher than 1% and have not received any compensation from the Companies discussed.
