Potential Trend Reversal in SCHAND.IN
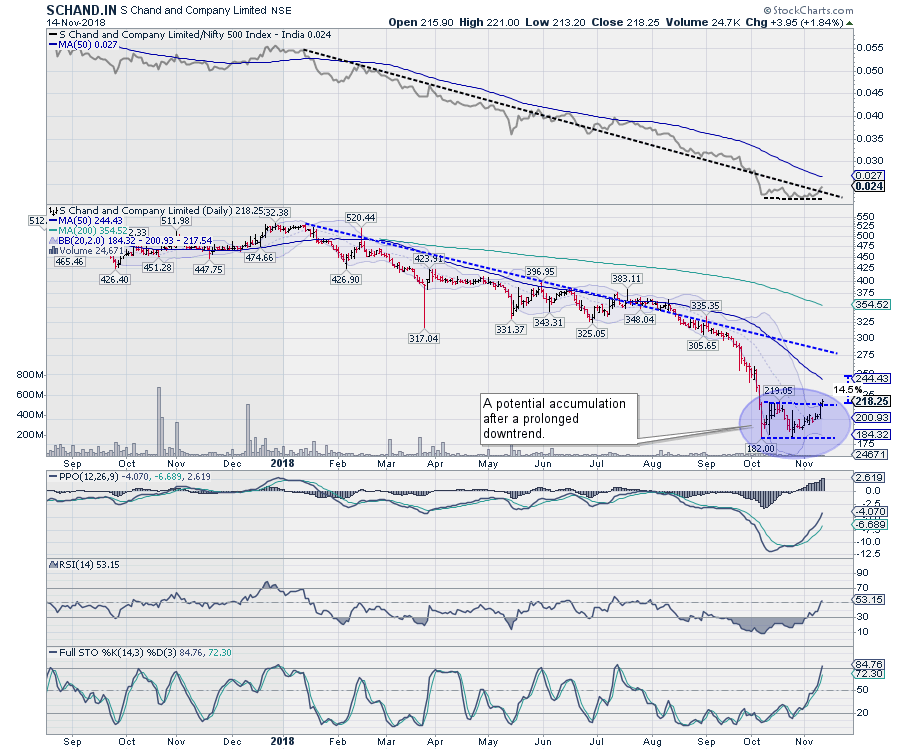
S Chand And Company Limited (SCHAND.IN) is one of the leading publishing houses in India. In May 2017, the stock listed at 673. Over the following 17 months, the stock saw its value erode by ~73% as the stock remained in a secular decline. In October 2018, the stock arrested its prolonged decline as it attempted to form a base around the 180-185 levels. The prices are presently seen trading in a sideways trajectory as the decline has stalled. A couple of signals have emerged which indicate that the stock might have completed its decline and may reverse its trend.
The prices have oscillated in the 182-215 zone for the past couple of days and are attempting to breakout from a rectangle formation. In the process, the prices have ended outside the upper Bollinger band. Though a temporary pullback inside the band may occur, this increases the probability of the prices breaking out in the upward direction with increased momentum. The RS Line against the Broader Markets ($CNX500) has also flattened and is attempting to move out of a falling trajectory.
PPO remains positive and in a firm uptrend. MACD, too, remains bullish and is in continuing buy mode. Daily RSI has marked a fresh 14-period high, which is bullish. It also shows a bullish divergence against the price.
If the prices see some upward revision, a pullback at least up to the 50-DMA level of 244 cannot be ruled out. It represents around ~14% of gains from the present level of 218. Any move below 185 will be negative for the stock.
Renewed Momentum in ADANITRANS.IN
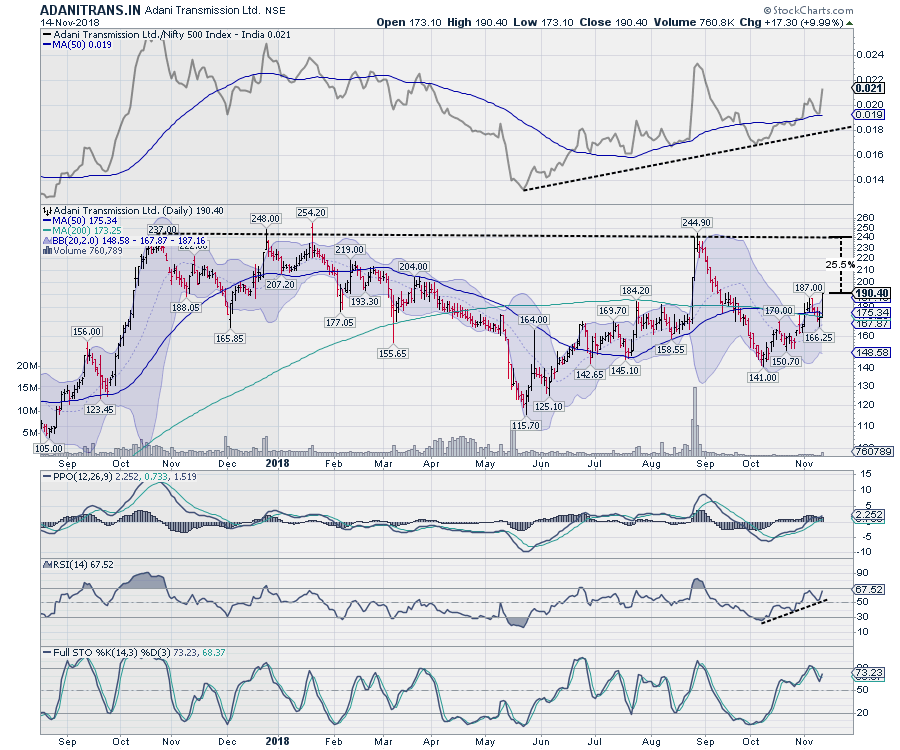
Adani Transmission Ltd (ADANITRANS.IN) has formed multiple resistance points in the range of 248 to 254 and it has made a corrective move every time it tested these levels. In September, it once again tested the 244 level and saw a sharp corrective move. The stock lost over 43% in this corrective action. After testing 141, the stock has seen some renewed momentum, which is reflected in the recent price action.
The stock has evidently improved its relative performance against the Broader Markets ($CNX500). RS Line continues to remain in an uptrend and, as a confirmation, the RS line has also penetrated its 50-DMA and moved above it. PPO remains positive on the Daily Chart. On the Weekly Chart, it has turned positive. Weekly MACD has also reported a positive crossover, which is bullish. RSI is seen marking a fresh 14-period high on both time frame charts and is moving upward, marking higher bottoms. Full Stochastic has started to look up. All of this is cumulatively likely to add momentum to the stock.
The price has ended outside the upper Bollinger band, and we may see higher probabilities of continued movement to the upside. If the stock tests its previous high at 244, it has the potential to return ~24% from the present price level of 190. Any move below 173 will be negative for the stock.
Milan Vaishnav, CMT, MSTA
Consulting Technical Analyst
www.EquityResearch.asia
Disclosure pursuant to Clause 19 of SEBI (Research Analysts) Regulations 2014: Analyst, Family Members or his Associates holds no financial interest below 1% or higher than 1% and has not received any compensation from the Companies discussed.


