Over the last four to five weeks, the NIFTY Bank Index ($BANKNIFTY) has not only out-performed the Public Sector Bank Index among the banking space, but it has also seen sharp improvement in relative momentum against the Broader Market Index $CNX500. Many of the Nifty Bank Index components are interestingly poised. A particularly attention-grabbing one is Axis Bank (AXISBANK.IN), which is readying itself for a decisive move over the coming days.
 Axis Bank (AXISBANK.IN) is one among the top 5 components of the NIFTY Bank Index, having 8.88% weight in the Index. That being said, let us examine some interesting signals that have recently become apparent on the charts.
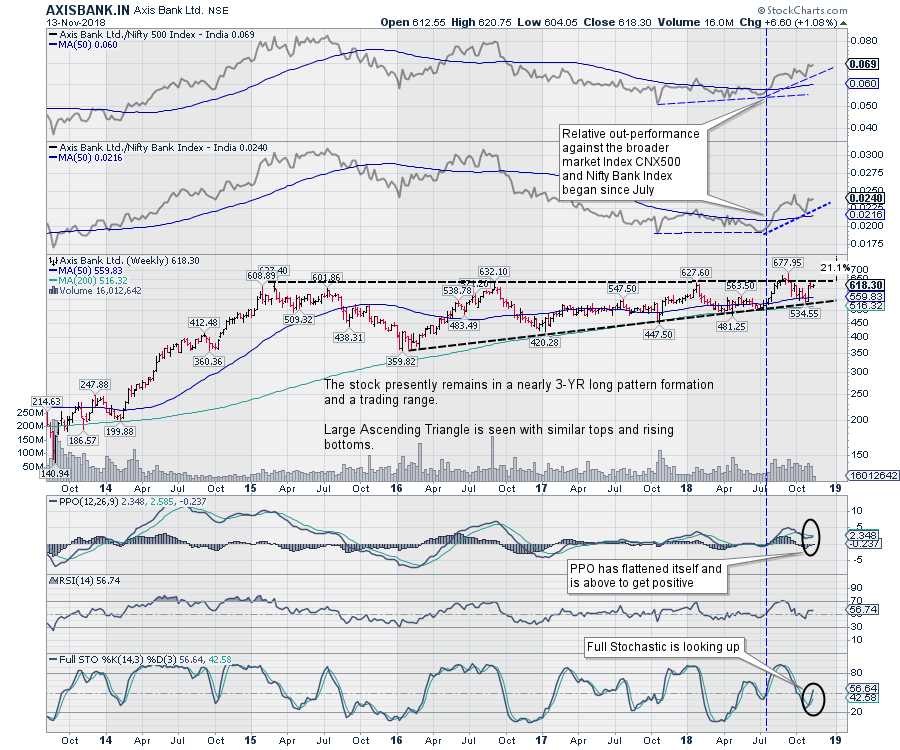
After under-performing for a couple of years against the Broader Market Index CNX500 and NIFTY Bank Index, the stock started to outperform these two benchmarks from the month of July 2018. This is marked by the vertical blue line drawn over the charts, which denotes the beginning of the relative out-performance of Axis Bank against both benchmarks. The outperformance is especially visible on the RS Line, which has flattened its trajectory and is experiencing an upward trend reversal when compared against both the CNX500 Index and the NIFTY Bank Index. The reversal was confirmed when the RS Line crossed and moved past its 50-Week Moving Average; the line is currently seen inching higher and marking higher bottoms.
While performing a pattern analysis of the stock, we see that the stock presently trades in a large Ascending Triangle formation, which has formed over the past 3 years. Typically, such formations are characterized by prices marking similar tops and higher bottoms. We can see that the price of Axis Bank remains under such a formation as of now. It is also important to note that the last bar on the chart is not yet complete, as we are in the middle of the week and the chart that is seen above is a weekly chart.
Additionally, the Full Stochastic is seen looking up. The PPO has flattened its trajectory and is on track to turn positive.
If a breakout on the anticipated lines occur, then the stock is likely to return around ~21% upside from the current level of 618.
We may still continue to see the stock witnessing some consolidation in a narrow range. However, in examining the weight of technical evidence that is available on the charts, we can expect a breakout on the upside over the coming weeks. Any move below 550 will be negative for the stock.
Milan Vaishnav, CMT, MSTA
Consulting Technical Analyst
www.EquityResearch.asia
Disclosure pursuant to Clause 19 of SEBI (Research Analysts) Regulations 2014: Analyst, Family Members or his Associates holds no financial interest below 1% or higher than 1% and has not received any compensation from the Companies discussed.
