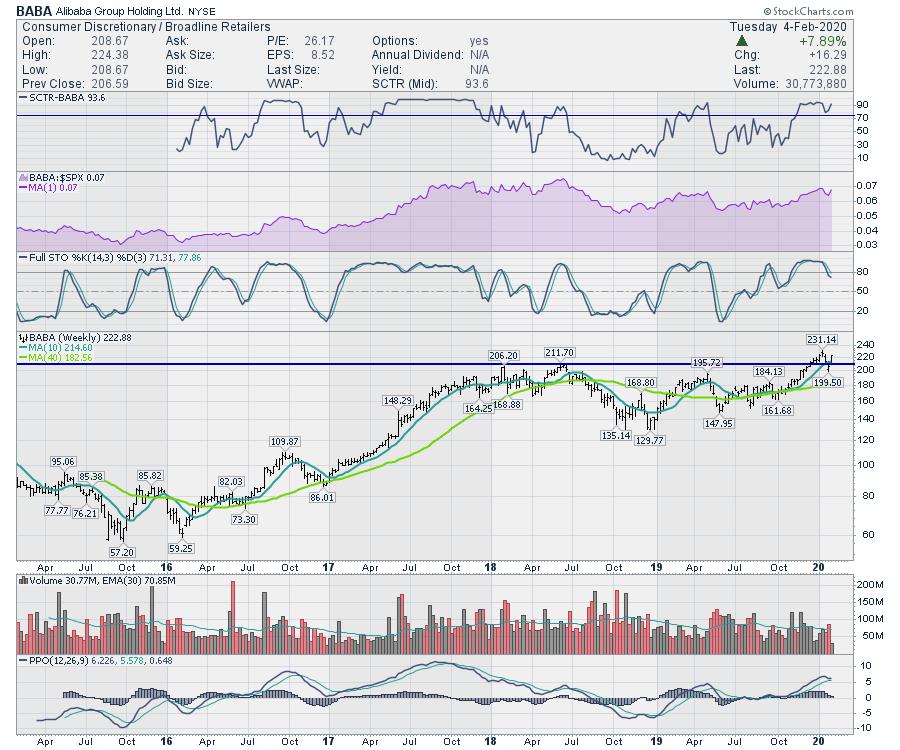
Alibaba (BABA) is holding one of the nicer charts, and the coronavirus has created a small back test to support. What makes the chart a little more interesting are the indicators.
The SCTR suggests that the recent push to new highs makes Alibaba one of the top-performing stocks. Currently, the price action is better than 93% of the stocks out there in the mid-cap space. I also like the purple Relative Strength (RS) outperforming the $SPX following a low last summer. An uptrend in relative strength is always good and the stock recently hit new 52-week highs in RS.

The full stochastic shows the chart dipping under 80, which is one negative, but it would appear the market is pricing in successful control of the virus and has started to rally. That should turn the full stochastic higher. The weekly charts can stay up above 80 for long periods on a strong stock. The volume has been right around the average lately, so all things are normal on that front. The PPO is currently rolling over in positive territory, but it is in an uptrend of momentum since December 2018.
The whole chart looks poised to work its way higher and, now that the backtest of support has appeared, the price pattern is suggesting it's ready to go higher here. A stop under $200 would make sure you leave if the breakout pattern starts to fail.
Good trading,
Greg Schnell, CMT, MFTA
Senior Technical Analyst, StockCharts.com
Author, Stock Charts For Dummies
Want to stay on top of the market's latest intermarket signals?
– Follow @SchnellInvestor on Twitter
– Connect with Greg on LinkedIn
– Subscribe to The Canadian Technician
– Email at info@gregschnell.com
