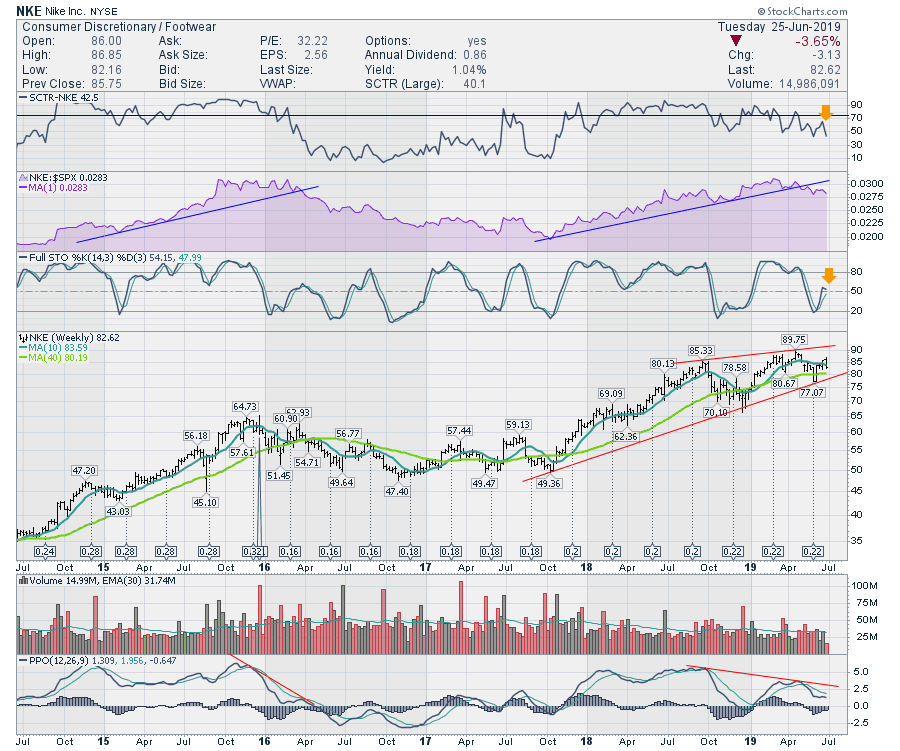
Everyday, the market presents new investing ideas. Sometimes it's a common brand resurgence, other times it's a macro thesis driving industry groups higher. This week, I noticed that the chart of Nike is not behaving nearly as well as Brooks Koepka, one of their celebrity brand ambassadors. Let's take a look at the indicators.
First of all, the SCTR shows Nike behaving in the bottom 40% of the stocks out there. While this is a weakness, it also shows that Nike is underperforming large-cap peers. The purple area chart, showing the relative strength to the $SPX, has broken its uptrend once again. As a stock starts to underperform the index, institutional investors will migrate towards building positions in stronger performers, trimming or selling positions that are starting to underperform. Notice that, in 2016, the break in relative strength trend was also helpful in diagnosing when the stock showed further underperformance over the next year. Importantly, the stock market was in a big uptrend through 2016, but Nike continued to trend down throughout the year. Changes in the trend of relative strength can be helpful for avoiding these setbacks.
The full stochastic indicator looks like it is rolling over near the 50 level. This is a trait that we see in bearish-trending stocks which is also a clue to watch Nike closely.
 Looking at the volume, Nike has volume trending lower, which does not suggest renewed interest here. The PPO indicator displays momentum and the chart looks weak. The momentum on the most recent April 2019 high was lower than the prior momentum peak in September while price is higher. This is negative divergence, which suggests the stock is wobbly here. If the PPO starts to turn down here, it will be as price approaches the uptrend line. The break in the price uptrend would obviously be a blaring announcement of the weakness. However, the indicators are definitely not in a strong position right here, giving us lots of warning that the stock may blow a shoe.
Information like this can help us set our exits to protect gains from the long 2-year move higher. After all, we wouldn't want this stock move to become a Zion Williamson shoe blowout. While the stock hasn't broken down yet, it looks more likely that weakness is coming, rather than a break higher.
Good trading,
Greg Schnell, CMT, MFTA
Senior Technical Analyst, StockCharts.com
Author, Stock Charts For Dummies
Want to stay on top of the market's latest intermarket signals?
– Follow @SchnellInvestor on Twitter
– Connect with Greg on LinkedIn
– Subscribe to The Canadian Technician
