In a market with 240-point swings based on 240-character tweets, it can be pretty hard to pick a direction. While the market churns through this current trade debate, we have a few more such debates on tap with Europe and Japan. As car tariffs with Europe could potentially start this weekend, the uncertainty looks set to continue.
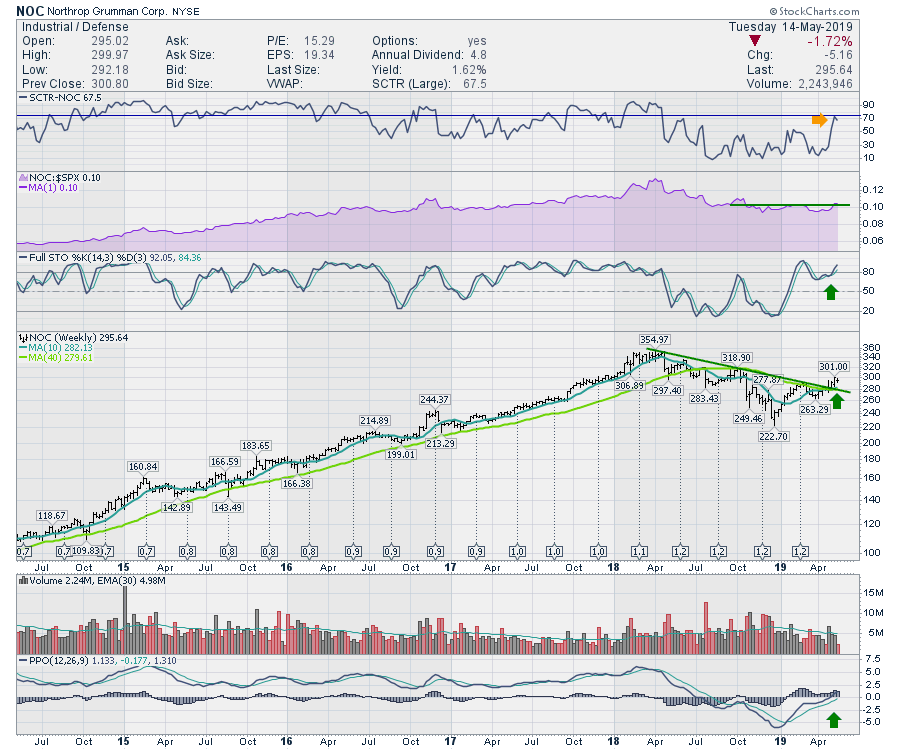
With all this going on, it makes sense to try insulating our portfolios with some stocks that might not be trade-related. One suggestion might be the defense stocks. While the market has pulled back from May 1st, Northrop Grumman has being moving in the opposite direction.
The weekly chart has a wonderful setup. Following a continuous run-up of four years, Northrop Grumman has spent a year creating a base, which looks like it is starting to build the right side. This week, it is trading at the top of the previous week's price bar. Last week, the stock made new six-month highs.
The SCTR is at its highest level in a year. The purple area signifies relative strength compared to the $SPX and made new 6-month highs. One of the other positive traits on the chart is that the momentum shown by the PPO has moved into positive territory for the first time since last July. Looking left, that looks like a great time to enter this stock as it was positive for four years.
 While I am still not comfortable that the overall market is headed higher, the defensive sectors have been leading the market lately. This move on NOC looks very strong compared to the other industrial stocks and is at a nice level for entry.
Currently, the chart for the defense industry group is breaking down. Trade carefully, though, in case NOC follows the group lower. With things heating up in the Middle East, it might be timely for defense stocks to start moving.
Good trading,
Greg Schnell, CMT, MFTA
Senior Technical Analyst, StockCharts.com
Author, Stock Charts For Dummies
Want to stay on top of the market's latest intermarket signals?
– Follow @SchnellInvestor on Twitter
– Connect with Greg on LinkedIn
– Subscribe to The Canadian Technician
